Compare commits
440
Commits
| Author | SHA1 | Date | |
|---|---|---|---|
 Daniel Lee Daniel Lee
|
3a892727b3 | ||
|
Daniel Lee
|
a9c535e551 | ||
 Torkel Ödegaard Torkel Ödegaard
|
17198807c9 | ||
|
Torkel Ödegaard
|
910e54d75e | ||
|
Torkel Ödegaard
|
5076460254 | ||
|
Torkel Ödegaard
|
2e7ac8f2da | ||
 Mitsuhiro Tanda Mitsuhiro Tanda
|
5e85558e9e | ||
|
Torkel Ödegaard
|
88672389f3 | ||
|
Torkel Ödegaard
|
2c3f3dffa3 | ||
|
Torkel Ödegaard
|
2c5563442f | ||
|
Torkel Ödegaard
|
f976e465c4 | ||
|
Torkel Ödegaard
|
4ce0bf4d16 | ||
|
Torkel Ödegaard
|
ab6740c685 | ||
|
Torkel Ödegaard
|
30b6c3b54a | ||
 Tiantian Gao Tiantian Gao
|
b2c14b858e | ||
 Suzana Pescador Suzana Pescador
|
8c9cc4fae1 | ||
|
Torkel Ödegaard
|
1d4338ba54 | ||
|
Torkel Ödegaard
|
0a68dabb89 | ||
|
Suzana Pescador
|
d6eefcb5ce | ||
 Pranay Kanwar Pranay Kanwar
|
ee8799de88 | ||
|
Daniel Lee
|
4a35126bf6 | ||
|
Daniel Lee
|
f350ae242b | ||
|
Daniel Lee
|
c21f86f6b4 | ||
 Torkel Ödegaard Torkel Ödegaard
|
d791f902e9 | ||
|
Torkel Ödegaard
|
acff78d421 | ||
|
Torkel Ödegaard
|
8bbff2c44e | ||
|
Torkel Ödegaard
|
e218052a90 | ||
|
Torkel Ödegaard
|
84141eb14a | ||
|
Torkel Ödegaard
|
79120a0b1f | ||
|
Torkel Ödegaard
|
8d072de556 | ||
 Anton Yackushev Anton Yackushev
|
fdc97010b4 | ||
|
Torkel Ödegaard
|
25a267a7ab | ||
|
Torkel Ödegaard
|
f168c9e53d | ||
|
Torkel Ödegaard
|
076a94560b | ||
|
Torkel Ödegaard
|
be284adacc | ||
|
Torkel Ödegaard
|
556829eda9 | ||
|
Torkel Ödegaard
|
823b40a360 | ||
|
Torkel Ödegaard
|
e2f0b42d90 | ||
 lpavlovi lpavlovi
|
c323d2fc4c | ||
 Dan Cech Dan Cech
|
e8fbfce59a | ||
|
Dan Cech
|
0f24b45c1a | ||
|
Dan Cech
|
29653d2bec | ||
|
Torkel Ödegaard
|
fbf39598b8 | ||
|
Torkel Ödegaard
|
ece21b2d95 | ||
|
Torkel Ödegaard
|
dd5a426911 | ||
|
Torkel Ödegaard
|
43c6f74904 | ||
|
Torkel Ödegaard
|
4412e41738 | ||
|
Torkel Ödegaard
|
5c9810fba4 | ||
|
Torkel Ödegaard
|
2479ad262e | ||
|
Torkel Ödegaard
|
e75bc5d39a | ||
|
Torkel Ödegaard
|
6ee11f1172 | ||
|
Torkel Ödegaard
|
f167d459fe | ||
|
Torkel Ödegaard
|
5acabc6ccb | ||
 Trent White Trent White
|
b4a8678cae | ||
|
Torkel Ödegaard
|
61b51c0cbf | ||
|
Torkel Ödegaard
|
0390a7c17b | ||
|
Torkel Ödegaard
|
11959f0c4c | ||
|
Torkel Ödegaard
|
dbcd19bbce | ||
 柯豪 柯豪
|
b7a1ff753a | ||
|
Torkel Ödegaard
|
0bab1fd088 | ||
|
Torkel Ödegaard
|
cbba692962 | ||
|
Torkel Ödegaard
|
e80e0c044b | ||
|
Daniel Lee
|
e08188929d | ||
|
Daniel Lee
|
b61de0cddc | ||
|
Torkel Ödegaard
|
287cd83e76 | ||
|
Torkel Ödegaard
|
59fdda6559 | ||
|
Torkel Ödegaard
|
ed8d284715 | ||
|
Torkel Ödegaard
|
e6c29391c6 | ||
|
Torkel Ödegaard
|
2304a710bf | ||
|
Daniel Lee
|
186a5e9d6f | ||
 Andrei Stefan Andrei Stefan
|
c57ec23a66 | ||
|
Torkel Ödegaard
|
b042c53980 | ||
 Vladimir Gordiychuk Vladimir Gordiychuk
|
deab4a378a | ||
|
Daniel Lee
|
44f76fdabc | ||
 Jon Freedman Jon Freedman
|
6ebb31bed4 | ||
|
Torkel Ödegaard
|
c1de972eb5 | ||
|
Andrei Stefan
|
53ccc6f48f | ||
|
Andrei Stefan
|
f43c749422 | ||
|
Andrei Stefan
|
ad3da0f47c | ||
 Dan Cech Dan Cech
|
665cf55e6e | ||
|
Daniel Lee
|
b4cfb225cf | ||
|
Daniel Lee
|
ac6c93b3da | ||
|
Torkel Ödegaard
|
0fd96b951a | ||
|
Daniel Lee
|
83c138f575 | ||
 rogerswingle rogerswingle
|
02455753b5 | ||
|
Torkel Ödegaard
|
88dd8af4ce | ||
|
Torkel Ödegaard
|
4f9f186575 | ||
|
Torkel Ödegaard
|
c46b73538c | ||
|
Torkel Ödegaard
|
0ac9ec8f7e | ||
|
Daniel Lee
|
c6d5259c6d | ||
|
Torkel Ödegaard
|
26f4a8e5a4 | ||
|
Torkel Ödegaard
|
a93fa0acde | ||
|
Torkel Ödegaard
|
b14c3d63e4 | ||
|
Dan Cech
|
2361e2ddd9 | ||
|
Dan Cech
|
b1691f1cd1 | ||
|
Torkel Ödegaard
|
24e3777894 | ||
|
Torkel Ödegaard
|
f5a6c306a6 | ||
 Mitja Z Mitja Z
|
c92d719a72 | ||
 Yaron de Leeuw Yaron de Leeuw
|
d4f7a2bc99 | ||
 Matt Toback Matt Toback
|
b909cfbde4 | ||
|
Torkel Ödegaard
|
a0d8afd435 | ||
|
Daniel Lee
|
f23239650e | ||
|
Daniel Lee
|
8f4c797399 | ||
|
Daniel Lee
|
6707d77af5 | ||
 smalik smalik
|
1a3bc60e69 | ||
|
Torkel Ödegaard
|
9e13c93379 | ||
|
Daniel Lee
|
dc1178acc8 | ||
 Tyghe Vallard Tyghe Vallard
|
1edeaa5e7e | ||
|
Torkel Ödegaard
|
d2a22e7b23 | ||
|
Torkel Ödegaard
|
19a04b7e4a | ||
|
Torkel Ödegaard
|
f6f2d85aa7 | ||
|
Daniel Lee
|
6538e86793 | ||
 fir4 fir4
|
6d9e8bd147 | ||
|
Torkel Ödegaard
|
368e847d12 | ||
|
Torkel Ödegaard
|
fe64ed424e | ||
|
Torkel Ödegaard
|
b780415f25 | ||
|
Daniel Lee
|
aee4af2148 | ||
|
Torkel Ödegaard
|
4720216e5e | ||
|
Torkel Ödegaard
|
9f462c0519 | ||
|
Torkel Ödegaard
|
b08b22192b | ||
|
Torkel Ödegaard
|
c3bad4701a | ||
|
Torkel Ödegaard
|
87c978ebc9 | ||
|
Torkel Ödegaard
|
8beb873db4 | ||
|
Torkel Ödegaard
|
8c448d95a1 | ||
|
Torkel Ödegaard
|
6ff1144abf | ||
|
Dan Cech
|
b489e93d94 | ||
|
Torkel Ödegaard
|
d085aaad41 | ||
|
Torkel Ödegaard
|
787fea90b9 | ||
|
Torkel Ödegaard
|
ae5e004b69 | ||
 sbhenderson sbhenderson
|
c485fed744 | ||
|
Daniel Lee
|
92d723d6f5 | ||
|
Torkel Ödegaard
|
9e0acdda23 | ||
|
Torkel Ödegaard
|
ef36ffb5d0 | ||
|
Torkel Ödegaard
|
48acffe095 | ||
|
Torkel Ödegaard
|
09b7516d47 | ||
|
Torkel Ödegaard
|
16d27a4a8d | ||
|
Torkel Ödegaard
|
663f7ee239 | ||
|
Torkel Ödegaard
|
b8259d7583 | ||
|
Torkel Ödegaard
|
2b029912aa | ||
|
Daniel Lee
|
7784e4e24b | ||
|
Daniel Lee
|
413ee33d5d | ||
|
Daniel Lee
|
d1e6f90f92 | ||
|
Torkel Ödegaard
|
8f17a84f31 | ||
|
Torkel Ödegaard
|
253b8be449 | ||
 Alexander-N Alexander-N
|
01fc6da3b2 | ||
|
Daniel Lee
|
fdc68a8baa | ||
|
Torkel Ödegaard
|
6ea99540ec | ||
|
Daniel Lee
|
6160978019 | ||
|
Daniel Lee
|
a49ef90a1d | ||
|
Torkel Ödegaard
|
b22b3e5bb9 | ||
|
Daniel Lee
|
8874be4c66 | ||
|
Daniel Lee
|
2c51f11440 | ||
|
Torkel Ödegaard
|
ea53e7221e | ||
|
Torkel Ödegaard
|
97e2d75f51 | ||
|
Torkel Ödegaard
|
c78c460f79 | ||
|
Daniel Lee
|
1bbc149089 | ||
|
Daniel Lee
|
459d195291 | ||
|
Daniel Lee
|
6ec1d16327 | ||
|
Torkel Ödegaard
|
50e70cf3db | ||
|
Torkel Ödegaard
|
fc878bc8ad | ||
|
Torkel Ödegaard
|
2cb2c4073e | ||
|
Torkel Ödegaard
|
4368c5a896 | ||
|
Torkel Ödegaard
|
f1276774a0 | ||
 raj dutt raj dutt
|
98266bd95a | ||
|
Torkel Ödegaard
|
11806dfa78 | ||
|
Daniel Lee
|
1e29d4fcfa | ||
|
Daniel Lee
|
ee3a553800 | ||
 Daniel Schmitz Daniel Schmitz
|
d123b951e9 | ||
|
Torkel Ödegaard
|
e164eba677 | ||
|
Daniel Schmitz
|
7078d5d524 | ||
|
Mitsuhiro Tanda
|
62d11c147b | ||
|
Torkel Ödegaard
|
456b07b766 | ||
|
Torkel Ödegaard
|
0bae7212f6 | ||
|
Torkel Ödegaard
|
73718afb79 | ||
|
Torkel Ödegaard
|
809467955a | ||
|
Torkel Ödegaard
|
db36639ffc | ||
|
Torkel Ödegaard
|
3ee886d0fb | ||
|
Torkel Ödegaard
|
85baa50194 | ||
|
Torkel Ödegaard
|
473006e8cf | ||
 Kevin Conaway Kevin Conaway
|
5dad324ab7 | ||
 Alexander Zobnin Alexander Zobnin
|
7aa992bde4 | ||
|
Alexander Zobnin
|
f0816b37bd | ||
|
Dan Cech
|
a64e000f1a | ||
|
Dan Cech
|
715453204e | ||
|
Alexander Zobnin
|
5df82be290 | ||
 Thomas Szymanski Thomas Szymanski
|
f2dffeb543 | ||
|
Torkel Ödegaard
|
fa2a7db657 | ||
|
Torkel Ödegaard
|
03ef1fd758 | ||
|
Torkel Ödegaard
|
60ef7d8768 | ||
|
Torkel Ödegaard
|
aa47b9bf5c | ||
|
Torkel Ödegaard
|
b77991f69b | ||
|
Dan Cech
|
f490c5f12c | ||
 Ivan Babrou Ivan Babrou
|
fb163450a5 | ||
|
Torkel Ödegaard
|
a151de1d37 | ||
|
Torkel Ödegaard
|
0335c1f368 | ||
|
Torkel Ödegaard
|
ea92ddccb3 | ||
|
Torkel Ödegaard
|
ff426ae9a3 | ||
|
Torkel Ödegaard
|
dbe5480edc | ||
|
Torkel Ödegaard
|
2fce88ee62 | ||
|
Dan Cech
|
3a607f96a3 | ||
|
Torkel Ödegaard
|
c68fffcd6d | ||
|
Torkel Ödegaard
|
2f61fc6afe | ||
|
Torkel Ödegaard
|
dbeeb32ab6 | ||
|
Alexander Zobnin
|
ab99a7c1c7 | ||
|
Torkel Ödegaard
|
dd3e594dd7 | ||
|
Torkel Ödegaard
|
9c246ba301 | ||
|
Alexander Zobnin
|
2142323da9 | ||
|
Alexander Zobnin
|
17d3970673 | ||
|
Alexander Zobnin
|
ef99ff0ad7 | ||
|
Alexander Zobnin
|
8a1c35e1c2 | ||
|
Torkel Ödegaard
|
de21be30d2 | ||
|
Alexander Zobnin
|
eeb998d712 | ||
|
Torkel Ödegaard
|
593b2ef866 | ||
|
Torkel Ödegaard
|
b867921b3b | ||
|
Torkel Ödegaard
|
0156a94a49 | ||
|
Alexander Zobnin
|
aff6aa081c | ||
|
Alexander Zobnin
|
d2f3d7d138 | ||
|
Torkel Ödegaard
|
78f4bd2de9 | ||
|
Torkel Ödegaard
|
752b42798a | ||
|
Alexander Zobnin
|
232513bb4e | ||
 Tyndie Tyndie
|
20ac8bf83e | ||
|
Torkel Ödegaard
|
8eb112d119 | ||
|
Torkel Ödegaard
|
e80494390a | ||
|
Torkel Ödegaard
|
b3df1aa9bd | ||
|
Mitsuhiro Tanda
|
d2bf2e86ed | ||
|
Torkel Ödegaard
|
09cec3118f | ||
 Chris Burkhart Chris Burkhart
|
d12dc2bfa7 | ||
|
Torkel Ödegaard
|
07466b6725 | ||
|
Torkel Ödegaard
|
a109049de4 | ||
|
Torkel Ödegaard
|
89a7c2c686 | ||
|
Torkel Ödegaard
|
83e0f69cde | ||
|
Torkel Ödegaard
|
9099119f62 | ||
|
Torkel Ödegaard
|
9bdcc4ec5f | ||
|
Torkel Ödegaard
|
e0640487df | ||
|
Daniel Lee
|
3ca3c96226 | ||
|
Alexander Zobnin
|
f42202e665 | ||
|
Alexander Zobnin
|
70bca219e3 | ||
|
Alexander Zobnin
|
d553498a33 | ||
|
Torkel Ödegaard
|
0384eecf5c | ||
|
Daniel Lee
|
2877ad1a7d | ||
|
Alexander Zobnin
|
362860f687 | ||
 Davide Setti Davide Setti
|
997da1b266 | ||
|
Torkel Ödegaard
|
337b3295bd | ||
 Simen Bekkhus Simen Bekkhus
|
21ae987bcd | ||
 Alfred Krohmer Alfred Krohmer
|
41171f8a5c | ||
|
Alexander Zobnin
|
32d34aed7a | ||
|
Torkel Ödegaard
|
efca9e904d | ||
|
Torkel Ödegaard
|
1cd632cc43 | ||
|
Torkel Ödegaard
|
26804d630f | ||
|
Torkel Ödegaard
|
3b47efe70e | ||
|
Torkel Ödegaard
|
7ec6e84fe8 | ||
|
Alexander Zobnin
|
7e14797b10 | ||
 tamayika tamayika
|
e6cc5df9d9 | ||
 wrp wrp
|
c219498aab | ||
|
Torkel Ödegaard
|
f5f0d94ad4 | ||
 Calle Pettersson Calle Pettersson
|
a79102b42d | ||
|
Alexander Zobnin
|
2b81bfe9bf | ||
|
Alexander Zobnin
|
308d46e4ef | ||
|
Torkel Ödegaard
|
48c4e549f5 | ||
|
Torkel Ödegaard
|
dd800fd14d | ||
|
Torkel Ödegaard
|
95e0010a5b | ||
|
Torkel Ödegaard
|
4a2efb1007 | ||
|
Alexander Zobnin
|
ecd404335e | ||
|
Torkel Ödegaard
|
f77f8ebfc6 | ||
|
Torkel Ödegaard
|
3ed1600b90 | ||
|
Torkel Ödegaard
|
39e45004cd | ||
|
Torkel Ödegaard
|
4445c9ce60 | ||
|
Torkel Ödegaard
|
5af81b974e | ||
|
Torkel Ödegaard
|
a7babfb7cf | ||
|
Torkel Ödegaard
|
bd3f825a6e | ||
|
Torkel Ödegaard
|
e5a5bef200 | ||
|
Alexander Zobnin
|
b18ed0b98f | ||
|
Torkel Ödegaard
|
d6d2080f11 | ||
|
Alexander Zobnin
|
cb136c07b8 | ||
|
Torkel Ödegaard
|
af0ecd440f | ||
|
Mitsuhiro Tanda
|
554f972a25 | ||
|
Alexander Zobnin
|
9ddfeaa9c2 | ||
|
Torkel Ödegaard
|
bd4f073425 | ||
|
Torkel Ödegaard
|
998f04e1e8 | ||
|
Alexander Zobnin
|
3170f0d84a | ||
|
Torkel Ödegaard
|
34d92b0e79 | ||
|
Alexander Zobnin
|
114431beed | ||
 timolehto timolehto
|
6e304e6e42 | ||
|
Torkel Ödegaard
|
080d2a2054 | ||
 Kazumasa Kohtaka Kazumasa Kohtaka
|
aada5181fa | ||
|
Torkel Ödegaard
|
00fcaaf171 | ||
|
Torkel Ödegaard
|
8f90c6115d | ||
|
Torkel Ödegaard
|
1ecdf34938 | ||
|
Torkel Ödegaard
|
c33fa27ed8 | ||
|
Torkel Ödegaard
|
6965064ea9 | ||
|
Torkel Ödegaard
|
91c184d3e0 | ||
|
Torkel Ödegaard
|
3b235612fd | ||
|
Daniel Lee
|
5702c57452 | ||
|
Alexander Zobnin
|
84b15fc74c | ||
|
Torkel Ödegaard
|
085c4c56b8 | ||
|
Alexander Zobnin
|
65a829b64d | ||
|
Alexander Zobnin
|
7c5b9f8c5b | ||
 Seuf Seuf
|
319b8d8fca | ||
|
Daniel Lee
|
ac39ed4218 | ||
|
Alexander Zobnin
|
7770c38e30 | ||
|
Alexander Zobnin
|
72e313a3dd | ||
|
Torkel Ödegaard
|
98554e9fbe | ||
|
Alexander Zobnin
|
ac347fa06a | ||
|
Alexander Zobnin
|
ece6fd73a1 | ||
|
Dan Cech
|
24d4e50343 | ||
 Jaroslav Hanslík Jaroslav Hanslík
|
e91a078105 | ||
 Dan Cech Dan Cech
|
dde8583db8 | ||
|
Alexander Zobnin
|
c9801595e5 | ||
|
Daniel Lee
|
09ec8cdebe | ||
 crmacleo crmacleo
|
54883e09d5 | ||
|
Alexander Zobnin
|
0a56db7745 | ||
|
Alexander Zobnin
|
0023657701 | ||
|
Alexander Zobnin
|
96e91b5a0f | ||
|
Alexander Zobnin
|
68f5e75eba | ||
|
Daniel Lee
|
44c9ba2edf | ||
|
Daniel Lee
|
08984448d0 | ||
 0x6875790d0a 0x6875790d0a
|
77ca62b1bc | ||
|
Daniel Lee
|
f45d637025 | ||
|
Daniel Lee
|
5773499dba | ||
|
Daniel Lee
|
beb85f413a | ||
|
Daniel Lee
|
79cef75fed | ||
|
Torkel Ödegaard
|
83d864e7e4 | ||
|
Torkel Ödegaard
|
6828d35480 | ||
|
Torkel Ödegaard
|
887867165c | ||
|
Torkel Ödegaard
|
7864828e75 | ||
 Tobias Wolf Tobias Wolf
|
68e6700663 | ||
|
Torkel Ödegaard
|
8aa00f9227 | ||
|
Torkel Ödegaard
|
b404f32a09 | ||
|
Daniel Lee
|
01f646c191 | ||
|
Torkel Ödegaard
|
7dd09d4185 | ||
 Matt Matt
|
578ba9bbd5 | ||
|
Torkel Ödegaard
|
362a349d9f | ||
 gomlgs gomlgs
|
e99137598e | ||
 Trent White Trent White
|
5ed7d65b0e | ||
|
Torkel Ödegaard
|
b21ad3c376 | ||
|
Trent White
|
a510d85480 | ||
|
Trent White
|
182a30e22c | ||
|
Trent White
|
d4f2f41088 | ||
|
Daniel Lee
|
69bec98962 | ||
|
Daniel Lee
|
b9940e618c | ||
|
Torkel Ödegaard
|
0c372f0b85 | ||
|
Daniel Lee
|
3d3357ee41 | ||
|
Daniel Lee
|
94498d533b | ||
|
Daniel Lee
|
65910db991 | ||
|
Torkel Ödegaard
|
c1c241698a | ||
|
Torkel Ödegaard
|
adf7645bf5 | ||
|
Daniel Lee
|
e527aebbf1 | ||
|
Torkel Ödegaard
|
be5c4f47a6 | ||
|
Torkel Ödegaard
|
3f76d76be6 | ||
|
Torkel Ödegaard
|
122b4695e7 | ||
|
Torkel Ödegaard
|
711081950e | ||
|
Torkel Ödegaard
|
dce63ec1d8 | ||
|
Torkel Ödegaard
|
970619ed52 | ||
|
Torkel Ödegaard
|
6f324cd794 | ||
|
Torkel Ödegaard
|
4d4e165be7 | ||
|
Mitsuhiro Tanda
|
a67497e679 | ||
 Jens L Jens L
|
5785bfe0cc | ||
 Denis Doria Denis Doria
|
87027b0f77 | ||
|
Torkel Ödegaard
|
50718b592c | ||
|
Dan Cech
|
51bdb60296 | ||
|
Dan Cech
|
737c29ec8c | ||
|
Torkel Ödegaard
|
aaf013b360 | ||
|
Torkel Ödegaard
|
19516ebcce | ||
 Andrii Skomorokhov Andrii Skomorokhov
|
5cb51631db | ||
|
Daniel Lee
|
76fa363613 | ||
 Pandurang Waghulde Pandurang Waghulde
|
f3cce7efc9 | ||
|
Daniel Lee
|
38cab50a0c | ||
|
Torkel Ödegaard
|
7856e2f16b | ||
|
Torkel Ödegaard
|
32f89f65da | ||
 Gregory Kman Gregory Kman
|
e9ad71abed | ||
|
Torkel Ödegaard
|
0b73369c4b | ||
|
Torkel Ödegaard
|
b05fca4fd7 | ||
|
Torkel Ödegaard
|
23954f775b | ||
|
Torkel Ödegaard
|
f42ef5fe17 | ||
|
Torkel Ödegaard
|
69ff97305f | ||
|
Torkel Ödegaard
|
967cdd73e1 | ||
|
Torkel Ödegaard
|
9e27b8ee47 | ||
|
Torkel Ödegaard
|
98b65641c3 | ||
|
Torkel Ödegaard
|
0bb8a920ca | ||
|
Torkel Ödegaard
|
b471e7e448 | ||
|
Torkel Ödegaard
|
e189400f7c | ||
|
Daniel Lee
|
b93a2887a8 | ||
|
Daniel Lee
|
84ef6b9d48 | ||
|
Denis Doria
|
891df21969 | ||
|
Daniel Lee
|
77921c4dcd | ||
 Jan Rückert Jan Rückert
|
8637207b55 | ||
|
Daniel Lee
|
2580b61088 | ||
|
Daniel Lee
|
6799b766a4 | ||
|
Torkel Ödegaard
|
25318f5848 | ||
|
Daniel Lee
|
e19b48840f | ||
|
Daniel Lee
|
28cf229707 | ||
|
Daniel Lee
|
22553b154a | ||
|
Daniel Lee
|
9b806bc209 | ||
|
thuck
|
58afb1c7d6 | ||
|
Daniel Lee
|
74c795b294 | ||
|
Daniel Lee
|
c176de89c9 | ||
|
Daniel Lee
|
a30cf204d7 | ||
|
Torkel Ödegaard
|
952cc1d883 | ||
|
Daniel Lee
|
2f5814d51c | ||
|
Torkel Ödegaard
|
7f8a3a0a2d | ||
|
Torkel Ödegaard
|
aee8f0b75e | ||
|
Torkel Ödegaard
|
b272f5144a | ||
|
Torkel Ödegaard
|
073dec8ba8 | ||
|
Torkel Ödegaard
|
bb2eb00b0e | ||
|
Mitsuhiro Tanda
|
be123a07c5 | ||
 hagen1778 hagen1778
|
04d90d7139 | ||
|
thuck
|
b8a82827b9 | ||
|
Daniel Lee
|
588955c752 | ||
|
Daniel Lee
|
bd348a47c7 | ||
|
Daniel Lee
|
4f06202e9a | ||
|
thuck
|
1cf569ac8e | ||
|
thuck
|
555acacd6d | ||
|
Daniel Lee
|
08b2edf98c | ||
|
thuck
|
c3eb9da160 | ||
|
thuck
|
f577dd0f38 | ||
 jifwin jifwin
|
c09cd4ba29 | ||
|
Mitsuhiro Tanda
|
988ed06970 | ||
|
Torkel Ödegaard
|
1d9b3871fa | ||
|
Torkel Ödegaard
|
bc9165bdfc | ||
|
Torkel Ödegaard
|
1e26a8e68a | ||
|
Torkel Ödegaard
|
0d8cdf0ebe | ||
|
Torkel Ödegaard
|
c05c6ee7a4 | ||
|
Torkel Ödegaard
|
0a17217d59 | ||
|
Torkel Ödegaard
|
10e100b080 | ||
|
Torkel Ödegaard
|
8a92861133 | ||
|
Grzegorz Pietrusza
|
a3019a9789 | ||
|
Grzegorz Pietrusza
|
220b65afd2 | ||
 Alexander Menzhinsky Alexander Menzhinsky
|
30c334a2b8 | ||
|
Torkel Ödegaard
|
01f1c1b8dc | ||
 Darrian Darrian
|
cdfb24ab85 | ||
|
Darrian
|
96f3ee9e4c | ||
|
Darrian
|
27ead53382 | ||
|
Darrian
|
b8572b69f0 | ||
|
Mitsuhiro Tanda
|
d018d2a23f | ||
 Nozomi Anzai Nozomi Anzai
|
157435a61c | ||
|
Nozomi Anzai
|
bdf68b2183 | ||
|
Nozomi Anzai
|
6586cc4029 | ||
 bigbenhur bigbenhur
|
ef623846c1 | ||
|
bigbenhur
|
29b9d17faa | ||
|
bigbenhur
|
1e4eb01059 |
+1
-1
@@ -3,7 +3,7 @@ root = true
|
||||
|
||||
[*.go]
|
||||
indent_style = tab
|
||||
indent_size = 2
|
||||
indent_size = 4
|
||||
charset = utf-8
|
||||
trim_trailing_whitespace = true
|
||||
insert_final_newline = true
|
||||
|
||||
+10
-10
@@ -1,5 +1,10 @@
|
||||
Please prefix your title with [Bug] or [Feature request]
|
||||
For question please check [Support Options](http://grafana.org/support/). **Do not** open a github issue
|
||||
Read before posting:
|
||||
|
||||
- Questions should be posted to https://community.grafana.com. Please search there and here on GitHub for similar issues before creating a new issue.
|
||||
- Checkout FAQ: https://community.grafana.com/c/howto/faq
|
||||
- Checkout How to troubleshoot metric query issues: https://community.grafana.com/t/how-to-troubleshoot-metric-query-issues/50
|
||||
|
||||
Please prefix your title with [Bug] or [Feature request].
|
||||
|
||||
Please include this information:
|
||||
- What Grafana version are you using?
|
||||
@@ -8,11 +13,6 @@ Please include this information:
|
||||
- What did you do?
|
||||
- What was the expected result?
|
||||
- What happened instead?
|
||||
|
||||
**IMPORTANT**
|
||||
If it relates to *metric data viz*:
|
||||
- An image or text representation of your metric query
|
||||
- The raw query and response for the network request (check this in chrome dev tools network tab, here you can see metric requests and other request, please include the request body and request response)
|
||||
|
||||
If it relates to *alerting*
|
||||
- An image of the test execution data fully expanded.
|
||||
- If related to metric query / data viz:
|
||||
- Include raw network request & response: get by opening Chrome Dev Tools (F12, Ctrl+Shift+I on windows, Cmd+Opt+I on Mac), go the network tab.
|
||||
|
||||
|
||||
@@ -25,6 +25,7 @@ public/css/*.min.css
|
||||
*.swp
|
||||
.idea/
|
||||
*.iml
|
||||
*.tmp
|
||||
.vscode/
|
||||
|
||||
/data/*
|
||||
|
||||
+65
-1
@@ -1,8 +1,70 @@
|
||||
# 4.3.0 (unreleased)
|
||||
|
||||
## Enhancements
|
||||
|
||||
* **InfluxDB**: influxdb query builder support for ORDER BY and LIMIT (allows TOPN queries) [#6065](https://github.com/grafana/grafana/issues/6065) Support influxdb's SLIMIT Feature [#7232](https://github.com/grafana/grafana/issues/7232) thx [@thuck](https://github.com/thuck)
|
||||
* **Panels**: Delay loading & Lazy load panels as they become visible (scrolled into view) [#5216](https://github.com/grafana/grafana/issues/5216) thx [@jifwin](https://github.com/jifwin)
|
||||
* **Graph**: Support auto grid min/max when using log scale [#3090](https://github.com/grafana/grafana/issues/3090), thx [@bigbenhur](https://github.com/bigbenhur)
|
||||
* **Graph**: Support for histograms [#600](https://github.com/grafana/grafana/issues/600)
|
||||
* **Prometheus**: Support table response formats (column per label) [#6140](https://github.com/grafana/grafana/issues/6140), thx [@mtanda](https://github.com/mtanda)
|
||||
* **Single Stat Panel**: support for non time series data [#6564](https://github.com/grafana/grafana/issues/6564)
|
||||
* **Server**: Monitoring Grafana (health check endpoint) [#3302](https://github.com/grafana/grafana/issues/3302)
|
||||
* **Heatmap**: Heatmap Panel [#7934](https://github.com/grafana/grafana/pull/7934)
|
||||
* **Elasticsearch**: histogram aggregation [#3164](https://github.com/grafana/grafana/issues/3164)
|
||||
|
||||
## Minor Enchancements
|
||||
|
||||
# 4.2.0-beta2 (unreleased)
|
||||
* **InfluxDB**: Small fix for the "glow" when focus the field for LIMIT and SLIMIT [#7799](https://github.com/grafana/grafana/pull/7799) thx [@thuck](https://github.com/thuck)
|
||||
* **Prometheus**: Make Prometheus query field a textarea [#7663](https://github.com/grafana/grafana/issues/7663), thx [@hagen1778](https://github.com/hagen1778)
|
||||
* **Prometheus**: Step parameter changed semantics to min step to reduce the load on Prometheus and rendering in browser [#8073](https://github.com/grafana/grafana/pull/8073), thx [@bobrik](https://github.com/bobrik)
|
||||
* **Templating**: Should not be possible to create self-referencing (recursive) template variable definitions [#7614](https://github.com/grafana/grafana/issues/7614) thx [@thuck](https://github.com/thuck)
|
||||
* **Cloudwatch**: Correctly obtain IAM roles within ECS container tasks [#7892](https://github.com/grafana/grafana/issues/7892) thx [@gomlgs](https://github.com/gomlgs)
|
||||
* **Units**: New number format: Scientific notation [#7781](https://github.com/grafana/grafana/issues/7781) thx [@cadnce](https://github.com/cadnce)
|
||||
* **Oauth**: Add common type for oauth authorization errors [#6428](https://github.com/grafana/grafana/issues/6428) thx [@amenzhinsky](https://github.com/amenzhinsky)
|
||||
* **Templating**: Data source variable now supports multi value and panel repeats [#7030](https://github.com/grafana/grafana/issues/7030) thx [@mtanda](https://github.com/mtanda)
|
||||
* **Telegram**: Telegram alert is not sending metric and legend. [#8110](https://github.com/grafana/grafana/issues/8110), thx [@bashgeek](https://github.com/bashgeek)
|
||||
* **Graph**: Support dashed lines [#514](https://github.com/grafana/grafana/issues/514), thx [@smalik03](https://github.com/smalik03)
|
||||
* **Table**: Support to change column header text [#3551](https://github.com/grafana/grafana/issues/3551)
|
||||
* **Alerting**: Better error when SMTP is not configured [#8093](https://github.com/grafana/grafana/issues/8093)
|
||||
* **Pushover**: Add an option to attach graph image link in Pushover notification [#8043](https://github.com/grafana/grafana/issues/8043) thx [@devkid](https://github.com/devkid)
|
||||
* **WebDAV**: Allow to set different ImageBaseUrl for WebDAV upload and image link [#7914](https://github.com/grafana/grafana/issues/7914)
|
||||
* **Panels**: type-ahead mixed datasource selection [#7697](https://github.com/grafana/grafana/issues/7697) thx [@mtanda](https://github.com/mtanda)
|
||||
* **Security**:User enumeration problem [#7619](https://github.com/grafana/grafana/issues/7619)
|
||||
* **InfluxDB**: Register new queries available in InfluxDB - Holt Winters [#5619](https://github.com/grafana/grafana/issues/5619) thx [@rikkuness](https://github.com/rikkuness)
|
||||
* **Server**: Support listening on a UNIX socket [#4030](https://github.com/grafana/grafana/issues/4030), thx [@mitjaziv](https://github.com/mitjaziv)
|
||||
* **Graph**: Support log scaling for values smaller 1 [#5278](https://github.com/grafana/grafana/issues/5278)
|
||||
* **InfluxDB**: Slow 'select measurement' rendering for InfluxDB [#2524](https://github.com/grafana/grafana/issues/2524), thx [@sbhenderson](https://github.com/sbhenderson)
|
||||
* **Config**: Configurable signout menu activation [#7968](https://github.com/grafana/grafana/pull/7968), thx [@seuf](https://github.com/seuf)
|
||||
|
||||
## Fixes
|
||||
* **Table Panel**: Fixed annotation display in table panel, [#8023](https://github.com/grafana/grafana/issues/8023)
|
||||
* **Dashboard**: If refresh is blocked due to tab not visible, then refresh when it becomes visible [#8076](https://github.com/grafana/grafana/issues/8076) thanks [@SimenB](https://github.com/SimenB)
|
||||
* **Snapshots**: Fixed problem with annotations & snapshots [#7659](https://github.com/grafana/grafana/issues/7659)
|
||||
* **Graph**: MetricSegment loses type when value is an asterisk [#8277](https://github.com/grafana/grafana/issues/8277), thx [@Gordiychuk](https://github.com/Gordiychuk)
|
||||
* **Alerting**: Alert notifications do not show charts when using a non public S3 bucket [#8250](https://github.com/grafana/grafana/issues/8250) thx [@rogerswingle](https://github.com/rogerswingle)
|
||||
* **Graph**: 100% client CPU usage on red alert glow animation [#8222](https://github.com/grafana/grafana/issues/8222)
|
||||
* **InfluxDB**: Templating: "All" query does match too much [#8165](https://github.com/grafana/grafana/issues/8165)
|
||||
* **Dashboard**: Description tooltip is not fully displayed [#7970](https://github.com/grafana/grafana/issues/7970)
|
||||
* **Proxy**: Redirect after switching Org does not obey sub path in root_url (using reverse proxy) [#8089](https://github.com/grafana/grafana/issues/8089)
|
||||
* **Templating**: Restoration of ad-hoc variable from URL does not work correctly [#8056](https://github.com/grafana/grafana/issues/8056) thx [@tamayika](https://github.com/tamayika)
|
||||
* **InfluxDB**: timeFilter cannot be used twice in alerts [#7969](https://github.com/grafana/grafana/issues/7969)
|
||||
* **MySQL**: 4-byte UTF8 not supported when using MySQL database (allows Emojis) [#7958](https://github.com/grafana/grafana/issues/7958)
|
||||
* **Alerting**: api/alerts and api/alert/:id hold previous data for "message" and "Message" field when field value is changed from "some string" to empty string. [#7927](https://github.com/grafana/grafana/issues/7927)
|
||||
* **Graph**: Cannot add fill below to series override [#7916](https://github.com/grafana/grafana/issues/7916)
|
||||
* **InfluxDB**: Influxb Datasource test passes even if the Database doesn't exist [#7864](https://github.com/grafana/grafana/issues/7864)
|
||||
* **Prometheus**: Displaying Prometheus annotations is incredibly slow [#7750](https://github.com/grafana/grafana/issues/7750), thx [@mtanda](https://github.com/mtanda)
|
||||
* **Graphite**: grafana generates empty find query to graphite -> 422 Unprocessable Entity [#7740](https://github.com/grafana/grafana/issues/7740)
|
||||
* **Admin**: make organisation filter case insensitive [#8194](https://github.com/grafana/grafana/issues/8194), thx [@Alexander-N](https://github.com/Alexander-N)
|
||||
|
||||
## Changes
|
||||
* **Elasticsearch**: Changed elasticsearch Terms aggregation to default to Min Doc Count to 1, and sort order to Top [#8321](https://github.com/grafana/grafana/issues/8321)
|
||||
|
||||
## Tech
|
||||
|
||||
* **Library Upgrade**: inconshreveable/log15 outdated - no support for solaris [#8262](https://github.com/grafana/grafana/issues/8262)
|
||||
* **Library Upgrade**: Upgrade Macaron [#7600](https://github.com/grafana/grafana/issues/7600)
|
||||
|
||||
# 4.2.0 (2017-03-22)
|
||||
## Minor Enhancements
|
||||
* **Templates**: Prevent use of the prefix `__` for templates in web UI [#7678](https://github.com/grafana/grafana/issues/7678)
|
||||
* **Threema**: Add emoji to Threema alert notifications [#7676](https://github.com/grafana/grafana/pull/7676) thx [@dbrgn](https://github.com/dbrgn)
|
||||
@@ -15,6 +77,7 @@
|
||||
* **Elasticsearch**: Unique Count on string fields in ElasticSearch [#3536](https://github.com/grafana/grafana/issues/3536), thx [@pyro2927](https://github.com/pyro2927)
|
||||
* **Templating**: Data source template variable that refers to other variable in regex filter [#6365](https://github.com/grafana/grafana/issues/6365) thx [@rlodge](https://github.com/rlodge)
|
||||
* **Admin**: Global User List: add search and pagination [#7469](https://github.com/grafana/grafana/issues/7469)
|
||||
* **User Management**: Invite UI is now disabled when login form is disabled [#7875](https://github.com/grafana/grafana/issues/7875)
|
||||
|
||||
## Bugfixes
|
||||
* **Webhook**: Use proxy settings from environment variables [#7710](https://github.com/grafana/grafana/issues/7710)
|
||||
@@ -23,6 +86,7 @@
|
||||
* **Docs**: router_logging not documented [#7723](https://github.com/grafana/grafana/issues/7723)
|
||||
* **Alerting**: Spelling mistake [#7739](https://github.com/grafana/grafana/pull/7739) thx [@woutersmit](https://github.com/woutersmit)
|
||||
* **Alerting**: Graph legend scrolls to top when an alias is toggled/clicked [#7680](https://github.com/grafana/grafana/issues/7680) thx [@p4ddy1](https://github.com/p4ddy1)
|
||||
* **Panels**: Fixed panel tooltip description after scrolling down [#7708](https://github.com/grafana/grafana/issues/7708) thx [@askomorokhov](https://github.com/askomorokhov)
|
||||
|
||||
# 4.2.0-beta1 (2017-02-27)
|
||||
|
||||
|
||||
@@ -1,16 +1,13 @@
|
||||
[Grafana](http://grafana.org) [](https://circleci.com/gh/grafana/grafana)
|
||||
[Grafana](https://grafana.com) [](https://circleci.com/gh/grafana/grafana)
|
||||
================
|
||||
[Website](http://grafana.org) |
|
||||
[Website](https://grafana.com) |
|
||||
[Twitter](https://twitter.com/grafana) |
|
||||
[IRC](https://webchat.freenode.net/?channels=grafana) |
|
||||
[](http://slack.raintank.io)
|
||||
[Slack](http://slack.raintank.io) |
|
||||
[Email](mailto:contact@grafana.org)
|
||||
[Community & Forum](https://community.grafana.com)
|
||||
|
||||
Grafana is an open source, feature rich metrics dashboard and graph editor for
|
||||
Graphite, Elasticsearch, OpenTSDB, Prometheus and InfluxDB.
|
||||
|
||||
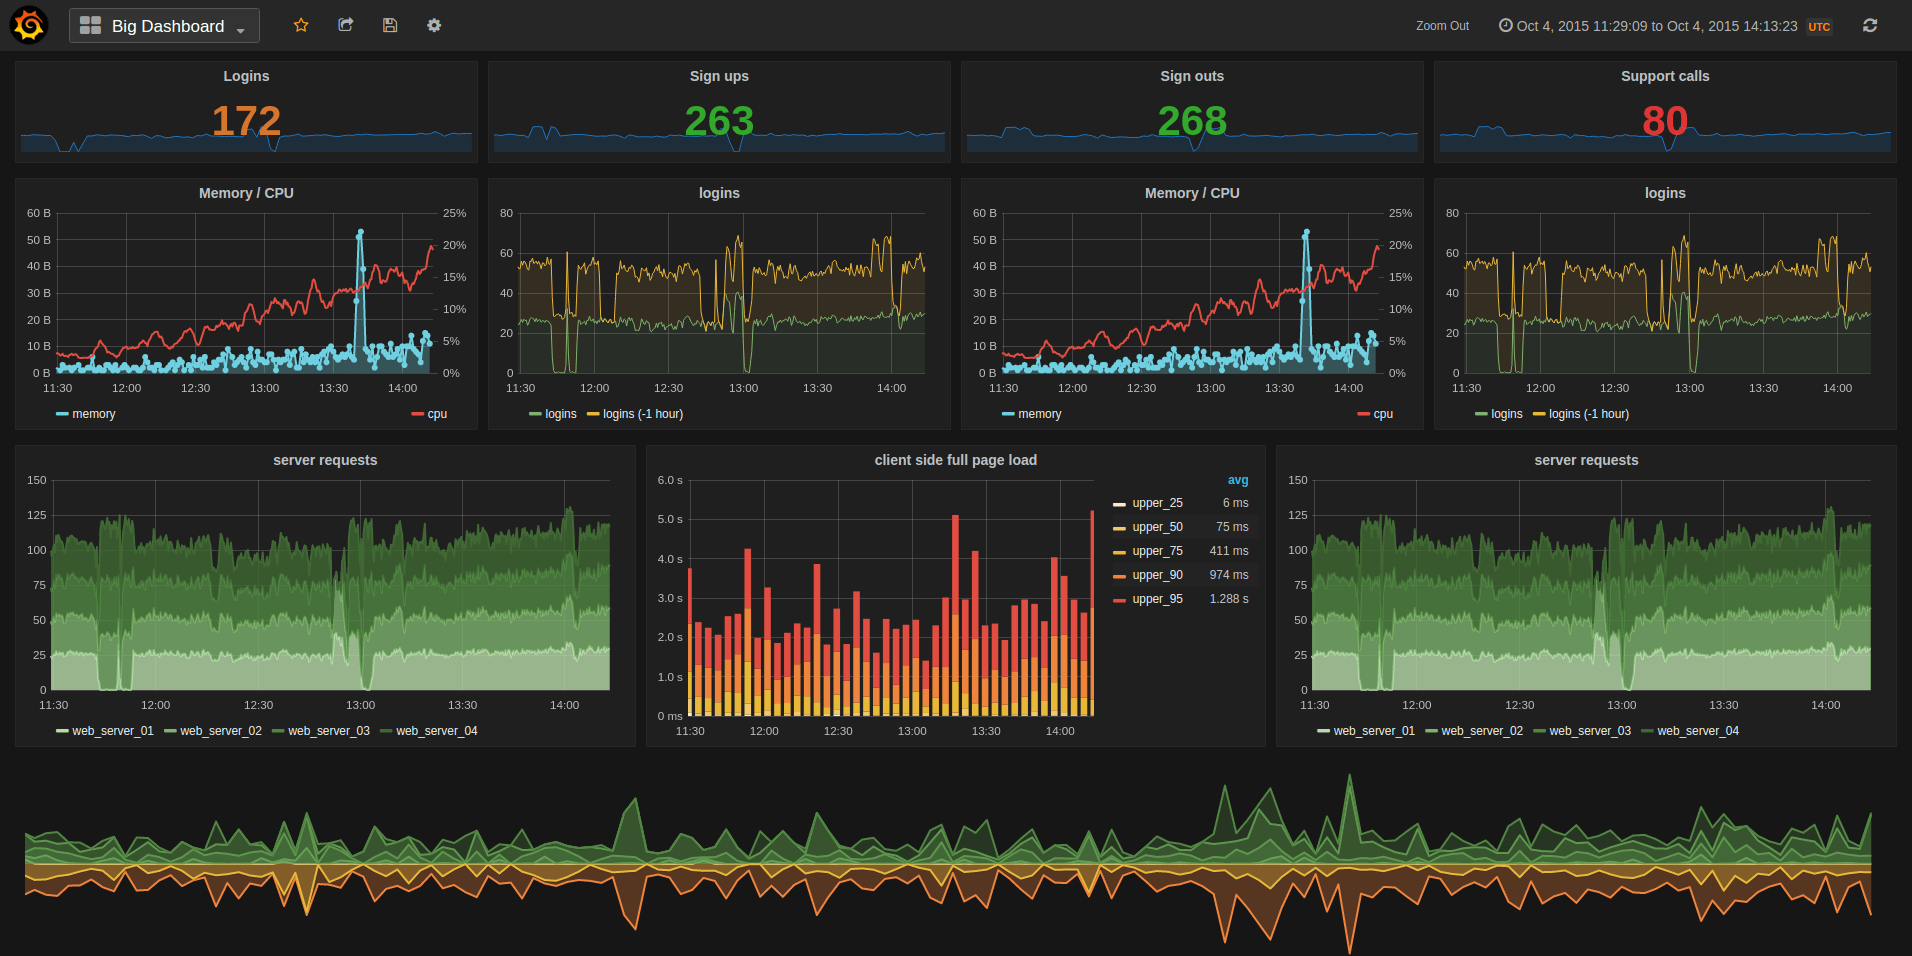
|
||||

|
||||
|
||||
- [Install instructions](http://docs.grafana.org/installation/)
|
||||
- [What's New in Grafana 2.0](http://docs.grafana.org/guides/whats-new-in-v2/)
|
||||
@@ -19,14 +16,9 @@ Graphite, Elasticsearch, OpenTSDB, Prometheus and InfluxDB.
|
||||
- [What's New in Grafana 3.0](http://docs.grafana.org/guides/whats-new-in-v3/)
|
||||
- [What's New in Grafana 4.0](http://docs.grafana.org/guides/whats-new-in-v4/)
|
||||
- [What's New in Grafana 4.1](http://docs.grafana.org/guides/whats-new-in-v4-1/)
|
||||
- [What's New in Grafana 4.2](http://docs.grafana.org/guides/whats-new-in-v4-2/)
|
||||
|
||||
## Features
|
||||
### Graphite Target Editor
|
||||
- Graphite target expression parser
|
||||
- Feature rich query composer
|
||||
- Quickly add and edit functions & parameters
|
||||
- Templated queries
|
||||
- [See it in action](http://docs.grafana.org/datasources/graphite/)
|
||||
|
||||
### Graphing
|
||||
- Fast rendering, even over large timespans
|
||||
@@ -50,16 +42,23 @@ Graphite, Elasticsearch, OpenTSDB, Prometheus and InfluxDB.
|
||||
- [Time range controls](http://docs.grafana.org/reference/timerange/)
|
||||
- [Share snapshots publicly](http://docs.grafana.org/v2.0/reference/sharing/)
|
||||
|
||||
### Elasticsearch
|
||||
- Feature rich query editor UI
|
||||
|
||||
### InfluxDB
|
||||
- Use InfluxDB as a metric data source, annotation source
|
||||
- Query editor with series and column typeahead, easy group by and function selection
|
||||
- Query editor with field and tag typeahead, easy group by and function selection
|
||||
|
||||
### OpenTSDB
|
||||
- Use as metric data source
|
||||
- Query editor with metric name typeahead and tag filtering
|
||||
### Graphite
|
||||
- Graphite target expression parser
|
||||
- Feature rich query composer
|
||||
- Quickly add and edit functions & parameters
|
||||
- Templated queries
|
||||
- [See it in action](http://docs.grafana.org/datasources/graphite/)
|
||||
|
||||
### Elasticsearch, Prometheus & OpenTSDB
|
||||
- Feature rich query editor UI
|
||||
|
||||
### Alerting
|
||||
- Define alert rules using graphs & query conditions
|
||||
- Schedule & evalute alert rules, send notifications to Slack, Hipchat, Email, PagerDuty, etc.
|
||||
|
||||
## Requirements
|
||||
There are no dependencies except an external time series data store. For dashboards and user accounts Grafana can use an embedded
|
||||
@@ -76,12 +75,12 @@ Be sure to read the [getting started guide](http://docs.grafana.org/guides/getti
|
||||
|
||||
## Run from master
|
||||
If you want to build a package yourself, or contribute. Here is a guide for how to do that. You can always find
|
||||
the latest master builds [here](http://grafana.org/builds)
|
||||
the latest master builds [here](https://grafana.com/grafana/download)
|
||||
|
||||
### Dependencies
|
||||
|
||||
- Go 1.8
|
||||
- NodeJS v4+
|
||||
- Go 1.8.1
|
||||
- NodeJS LTS
|
||||
|
||||
### Get Code
|
||||
|
||||
|
||||
+31
@@ -0,0 +1,31 @@
|
||||
# Roadmap (2017-04-23)
|
||||
|
||||
This roadmap is a tentative plan for the core development team. Things change constantly as PRs come in and priorities change.
|
||||
But it will give you an idea of our current vision and plan.
|
||||
|
||||
### Short term (1-4 months)
|
||||
|
||||
- New Heatmap Panel (Implemented and available in master)
|
||||
- Support for MySQL & Postgres as data sources (Work started and a alpha version for MySQL is available in master)
|
||||
- User Groups & Dashboard folders with ACLs (work started, not yet completed, https://github.com/grafana/grafana/issues/1611#issuecomment-287742633)
|
||||
- Improve new user UX
|
||||
- Improve docs
|
||||
- Support for alerting for Elasticsearch (can be tested in [branch](https://github.com/grafana/grafana/tree/alerting-elasticsearch) but needs more work)
|
||||
- Graph annotations (create from grafana, region annotations, better annotation viz)
|
||||
- Improve alerting (clustering, silence rules)
|
||||
|
||||
### Long term
|
||||
|
||||
- Improved dashboard panel layout engine (to make it easier and enable more flexible layouts)
|
||||
- Backend plugins to support more Auth options, Alerting data sources & notifications
|
||||
- Universial time series transformations for any data source (meta queries)
|
||||
- Reporting
|
||||
- Web socket & live data streams
|
||||
- Migrate to Angular2
|
||||
|
||||
|
||||
### Outside contributions
|
||||
We know this is being worked on right now by contributors (and we hope to merge it when it's ready).
|
||||
|
||||
- Dashboard revisions (be able to revert dashboard changes)
|
||||
- Clustering for alert engine (load distribution)
|
||||
@@ -351,7 +351,7 @@ func grunt(params ...string) {
|
||||
func gruntBuildArg(task string) []string {
|
||||
args := []string{task}
|
||||
if includeBuildNumber {
|
||||
args = append(args, fmt.Sprintf("--pkgVer=%v-%v", version, linuxPackageIteration))
|
||||
args = append(args, fmt.Sprintf("--pkgVer=%v-%v", linuxPackageVersion, linuxPackageIteration))
|
||||
} else {
|
||||
args = append(args, fmt.Sprintf("--pkgVer=%v", version))
|
||||
}
|
||||
|
||||
@@ -45,6 +45,7 @@ deployment:
|
||||
- aws s3 sync ./dist s3://$BUCKET_NAME/master
|
||||
- ./scripts/trigger_windows_build.sh ${APPVEYOR_TOKEN} ${CIRCLE_SHA1} master
|
||||
- ./scripts/trigger_docker_build.sh ${TRIGGER_GRAFANA_PACKER_CIRCLECI_TOKEN}
|
||||
- go run ./scripts/build/publish.go -apiKey ${GRAFANA_COM_API_KEY}
|
||||
gh_tag:
|
||||
tag: /^v[0-9]+(\.[0-9]+){2}(-.+|[^-.]*)$/
|
||||
commands:
|
||||
|
||||
+15
-9
@@ -25,7 +25,7 @@ plugins = data/plugins
|
||||
|
||||
#################################### Server ##############################
|
||||
[server]
|
||||
# Protocol (http or https)
|
||||
# Protocol (http, https, socket)
|
||||
protocol = http
|
||||
|
||||
# The ip address to bind to, empty will bind to all interfaces
|
||||
@@ -57,24 +57,26 @@ enable_gzip = false
|
||||
cert_file =
|
||||
cert_key =
|
||||
|
||||
# Unix socket path
|
||||
socket = /tmp/grafana.sock
|
||||
|
||||
#################################### Database ############################
|
||||
[database]
|
||||
# You can configure the database connection by specifying type, host, name, user and password
|
||||
# as seperate properties or as on string using the url propertie.
|
||||
# as separate properties or as on string using the url property.
|
||||
|
||||
# Either "mysql", "postgres" or "sqlite3", it's your choice
|
||||
type = sqlite3
|
||||
host = 127.0.0.1:3306
|
||||
name = grafana
|
||||
user = root
|
||||
# If the password contains # or ; you have to wrap it with trippel quotes. Ex """#password;"""
|
||||
# If the password contains # or ; you have to wrap it with triple quotes. Ex """#password;"""
|
||||
password =
|
||||
# Use either URL or the previous fields to configure the database
|
||||
# Example: mysql://user:secret@host:port/database
|
||||
url =
|
||||
|
||||
# Max conn setting default is 0 (mean not set)
|
||||
max_conn =
|
||||
max_idle_conn =
|
||||
max_open_conn =
|
||||
|
||||
@@ -132,11 +134,11 @@ logging = false
|
||||
# Change this option to false to disable reporting.
|
||||
reporting_enabled = true
|
||||
|
||||
# Set to false to disable all checks to https://grafana.net
|
||||
# for new vesions (grafana itself and plugins), check is used
|
||||
# Set to false to disable all checks to https://grafana.com
|
||||
# for new versions (grafana itself and plugins), check is used
|
||||
# in some UI views to notify that grafana or plugin update exists
|
||||
# This option does not cause any auto updates, nor send any information
|
||||
# only a GET request to http://grafana.net to get latest versions
|
||||
# only a GET request to https://grafana.com to get latest versions
|
||||
check_for_updates = true
|
||||
|
||||
# Google Analytics universal tracking code, only enabled if you specify an id here
|
||||
@@ -206,6 +208,9 @@ default_theme = dark
|
||||
# Set to true to disable (hide) the login form, useful if you use OAuth
|
||||
disable_login_form = false
|
||||
|
||||
# Set to true to disable the signout link in the side menu. useful if you use auth.proxy
|
||||
disable_signout_menu = false
|
||||
|
||||
#################################### Anonymous Auth ######################
|
||||
[auth.anonymous]
|
||||
# enable anonymous access
|
||||
@@ -243,7 +248,7 @@ api_url = https://www.googleapis.com/oauth2/v1/userinfo
|
||||
allowed_domains =
|
||||
hosted_domain =
|
||||
|
||||
#################################### Grafana.net Auth ####################
|
||||
#################################### Grafana.com Auth ####################
|
||||
[auth.grafananet]
|
||||
enabled = false
|
||||
allow_sign_up = true
|
||||
@@ -426,7 +431,7 @@ address =
|
||||
prefix = prod.grafana.%(instance_name)s.
|
||||
|
||||
[grafana_net]
|
||||
url = https://grafana.net
|
||||
url = https://grafana.com
|
||||
|
||||
#################################### External Image Storage ##############
|
||||
[external_image_storage]
|
||||
@@ -442,3 +447,4 @@ secret_key =
|
||||
url =
|
||||
username =
|
||||
password =
|
||||
public_url =
|
||||
|
||||
+1
-1
@@ -14,7 +14,7 @@ start_tls = false
|
||||
# set to true if you want to skip ssl cert validation
|
||||
ssl_skip_verify = false
|
||||
# set to the path to your root CA certificate or leave unset to use system defaults
|
||||
# root_ca_cert = /path/to/certificate.crt
|
||||
# root_ca_cert = "/path/to/certificate.crt"
|
||||
|
||||
# Search user bind dn
|
||||
bind_dn = "cn=admin,dc=grafana,dc=org"
|
||||
|
||||
+13
-7
@@ -26,7 +26,7 @@
|
||||
#
|
||||
#################################### Server ####################################
|
||||
[server]
|
||||
# Protocol (http or https)
|
||||
# Protocol (http, https, socket)
|
||||
;protocol = http
|
||||
|
||||
# The ip address to bind to, empty will bind to all interfaces
|
||||
@@ -59,6 +59,9 @@
|
||||
;cert_file =
|
||||
;cert_key =
|
||||
|
||||
# Unix socket path
|
||||
;socket =
|
||||
|
||||
#################################### Database ####################################
|
||||
[database]
|
||||
# You can configure the database connection by specifying type, host, name, user and password
|
||||
@@ -83,7 +86,6 @@
|
||||
;path = grafana.db
|
||||
|
||||
# Max conn setting default is 0 (mean not set)
|
||||
;max_conn =
|
||||
;max_idle_conn =
|
||||
;max_open_conn =
|
||||
|
||||
@@ -129,7 +131,7 @@
|
||||
# for new vesions (grafana itself and plugins), check is used
|
||||
# in some UI views to notify that grafana or plugin update exists
|
||||
# This option does not cause any auto updates, nor send any information
|
||||
# only a GET request to http://grafana.net to get latest versions
|
||||
# only a GET request to http://grafana.com to get latest versions
|
||||
;check_for_updates = true
|
||||
|
||||
# Google Analytics universal tracking code, only enabled if you specify an id here
|
||||
@@ -193,6 +195,9 @@
|
||||
# Set to true to disable (hide) the login form, useful if you use OAuth, defaults to false
|
||||
;disable_login_form = false
|
||||
|
||||
# Set to true to disable the signout link in the side menu. useful if you use auth.proxy, defaults to false
|
||||
;disable_signout_menu = false
|
||||
|
||||
#################################### Anonymous Auth ##########################
|
||||
[auth.anonymous]
|
||||
# enable anonymous access
|
||||
@@ -243,7 +248,7 @@
|
||||
;team_ids =
|
||||
;allowed_organizations =
|
||||
|
||||
#################################### Grafana.net Auth ####################
|
||||
#################################### Grafana.com Auth ####################
|
||||
[auth.grafananet]
|
||||
;enabled = false
|
||||
;allow_sign_up = true
|
||||
@@ -379,10 +384,10 @@
|
||||
;address =
|
||||
;prefix = prod.grafana.%(instance_name)s.
|
||||
|
||||
#################################### Internal Grafana Metrics ##########################
|
||||
# Url used to to import dashboards directly from Grafana.net
|
||||
#################################### Grafana.com integration ##########################
|
||||
# Url used to to import dashboards directly from Grafana.com
|
||||
[grafana_net]
|
||||
;url = https://grafana.net
|
||||
;url = https://grafana.com
|
||||
|
||||
#################################### External image storage ##########################
|
||||
[external_image_storage]
|
||||
@@ -397,5 +402,6 @@
|
||||
|
||||
[external_image_storage.webdav]
|
||||
;url =
|
||||
;public_url =
|
||||
;username =
|
||||
;password =
|
||||
|
||||
@@ -7,3 +7,8 @@ mysql:
|
||||
MYSQL_PASSWORD: password
|
||||
ports:
|
||||
- "3306:3306"
|
||||
volumes:
|
||||
- /etc/localtime:/etc/localtime:ro
|
||||
- /etc/timezone:/etc/timezone:ro
|
||||
command: [mysqld, --character-set-server=utf8mb4, --collation-server=utf8mb4_unicode_ci, --innodb_monitor_enable=all]
|
||||
|
||||
|
||||
@@ -0,0 +1,20 @@
|
||||
## MySQL with Open Data Set from NYC Open Data (https://data.cityofnewyork.us)
|
||||
|
||||
FROM mysql:latest
|
||||
|
||||
ENV MYSQL_DATABASE="testdata" \
|
||||
MYSQL_ROOT_PASSWORD="rootpass" \
|
||||
MYSQL_USER="grafana" \
|
||||
MYSQL_PASSWORD="password"
|
||||
|
||||
# Install requirement (wget)
|
||||
RUN apt-get update && apt-get install -y wget && apt-get install unzip
|
||||
|
||||
# Fetch NYC Data Set
|
||||
RUN wget https://data.cityofnewyork.us/download/57g5-etyj/application%2Fzip -O /tmp/data.zip && \
|
||||
unzip -j /tmp/data.zip 311_Service_Requests_from_2015.csv -d /var/lib/mysql-files && \
|
||||
rm /tmp/data.zip
|
||||
|
||||
ADD import_csv.sql /docker-entrypoint-initdb.d/
|
||||
|
||||
EXPOSE 3306
|
||||
@@ -0,0 +1,9 @@
|
||||
mysql_opendata:
|
||||
build: blocks/mysql_opendata
|
||||
environment:
|
||||
MYSQL_ROOT_PASSWORD: rootpass
|
||||
MYSQL_DATABASE: testdata
|
||||
MYSQL_USER: grafana
|
||||
MYSQL_PASSWORD: password
|
||||
ports:
|
||||
- "3307:3306"
|
||||
@@ -0,0 +1,80 @@
|
||||
use testdata;
|
||||
DROP TABLE IF EXISTS `nyc_open_data`;
|
||||
CREATE TABLE IF NOT EXISTS `nyc_open_data` (
|
||||
UniqueKey bigint(255),
|
||||
`CreatedDate` varchar(255),
|
||||
`ClosedDate` varchar(255),
|
||||
Agency varchar(255),
|
||||
AgencyName varchar(255),
|
||||
ComplaintType varchar(255),
|
||||
Descriptor varchar(255),
|
||||
LocationType varchar(255),
|
||||
IncidentZip varchar(255),
|
||||
IncidentAddress varchar(255),
|
||||
StreetName varchar(255),
|
||||
CrossStreet1 varchar(255),
|
||||
CrossStreet2 varchar(255),
|
||||
IntersectionStreet1 varchar(255),
|
||||
IntersectionStreet2 varchar(255),
|
||||
AddressType varchar(255),
|
||||
City varchar(255),
|
||||
Landmark varchar(255),
|
||||
FacilityType varchar(255),
|
||||
Status varchar(255),
|
||||
`DueDate` varchar(255),
|
||||
ResolutionDescription varchar(2048),
|
||||
`ResolutionActionUpdatedDate` varchar(255),
|
||||
CommunityBoard varchar(255),
|
||||
Borough varchar(255),
|
||||
XCoordinateStatePlane varchar(255),
|
||||
YCoordinateStatePlane varchar(255),
|
||||
ParkFacilityName varchar(255),
|
||||
ParkBorough varchar(255),
|
||||
SchoolName varchar(255),
|
||||
SchoolNumber varchar(255),
|
||||
SchoolRegion varchar(255),
|
||||
SchoolCode varchar(255),
|
||||
SchoolPhoneNumber varchar(255),
|
||||
SchoolAddress varchar(255),
|
||||
SchoolCity varchar(255),
|
||||
SchoolState varchar(255),
|
||||
SchoolZip varchar(255),
|
||||
SchoolNotFound varchar(255),
|
||||
SchoolOrCitywideComplaint varchar(255),
|
||||
VehicleType varchar(255),
|
||||
TaxiCompanyBorough varchar(255),
|
||||
TaxiPickUpLocation varchar(255),
|
||||
BridgeHighwayName varchar(255),
|
||||
BridgeHighwayDirection varchar(255),
|
||||
RoadRamp varchar(255),
|
||||
BridgeHighwaySegment varchar(255),
|
||||
GarageLotName varchar(255),
|
||||
FerryDirection varchar(255),
|
||||
FerryTerminalName varchar(255),
|
||||
Latitude varchar(255),
|
||||
Longitude varchar(255),
|
||||
Location varchar(255)
|
||||
);
|
||||
LOAD DATA INFILE '/var/lib/mysql-files/311_Service_Requests_from_2015.csv' INTO TABLE nyc_open_data FIELDS OPTIONALLY ENCLOSED BY '"' TERMINATED BY ',' IGNORE 1 LINES;
|
||||
UPDATE nyc_open_data SET CreatedDate = STR_TO_DATE(CreatedDate, '%m/%d/%Y %r') WHERE CreatedDate <> '';
|
||||
UPDATE nyc_open_data SET ClosedDate = STR_TO_DATE(ClosedDate, '%m/%d/%Y %r') WHERE ClosedDate <> '';
|
||||
UPDATE nyc_open_data SET DueDate = STR_TO_DATE(DueDate, '%m/%d/%Y %r') WHERE DueDate <> '';
|
||||
UPDATE nyc_open_data SET ResolutionActionUpdatedDate = STR_TO_DATE(ResolutionActionUpdatedDate, '%m/%d/%Y %r') WHERE ResolutionActionUpdatedDate <> '';
|
||||
|
||||
UPDATE nyc_open_data SET CreatedDate=null WHERE CreatedDate = '';
|
||||
UPDATE nyc_open_data SET ClosedDate=null WHERE ClosedDate = '';
|
||||
UPDATE nyc_open_data SET DueDate=null WHERE DueDate = '';
|
||||
UPDATE nyc_open_data SET ResolutionActionUpdatedDate=null WHERE ResolutionActionUpdatedDate = '';
|
||||
|
||||
ALTER TABLE nyc_open_data modify CreatedDate datetime NULL;
|
||||
ALTER TABLE nyc_open_data modify ClosedDate datetime NULL;
|
||||
ALTER TABLE nyc_open_data modify DueDate datetime NULL;
|
||||
ALTER TABLE nyc_open_data modify ResolutionActionUpdatedDate datetime NULL;
|
||||
|
||||
ALTER TABLE `nyc_open_data` ADD INDEX `IX_ComplaintType` (`ComplaintType`);
|
||||
ALTER TABLE `nyc_open_data` ADD INDEX `IX_CreatedDate` (`CreatedDate`);
|
||||
ALTER TABLE `nyc_open_data` ADD INDEX `IX_LocationType` (`LocationType`);
|
||||
ALTER TABLE `nyc_open_data` ADD INDEX `IX_AgencyName` (`AgencyName`);
|
||||
ALTER TABLE `nyc_open_data` ADD INDEX `IX_City` (`City`);
|
||||
|
||||
SYSTEM rm /var/lib/mysql-files/311_Service_Requests_from_2015.csv
|
||||
@@ -3,8 +3,6 @@ prometheus:
|
||||
net: host
|
||||
ports:
|
||||
- "9090:9090"
|
||||
volumes:
|
||||
- /var/docker/prometheus:/prometheus-data
|
||||
|
||||
node_exporter:
|
||||
image: prom/node-exporter
|
||||
|
||||
@@ -1,4 +1,4 @@
|
||||
snmpd:
|
||||
build: blocks/snmpd
|
||||
image: namshi/smtp
|
||||
ports:
|
||||
- "161:161"
|
||||
- "25:25"
|
||||
|
||||
+3
-2
@@ -3,10 +3,11 @@ FROM grafana/docs-base:latest
|
||||
# to get the git info for this repo
|
||||
# COPY config.toml /site
|
||||
|
||||
RUN rm -rf /site/content/*
|
||||
# RUN rm -rf /site/content/*
|
||||
|
||||
COPY ./sources /site/content/
|
||||
# COPY ./sources /site/content/docs/
|
||||
|
||||
COPY config.toml /site
|
||||
COPY awsconfig /site
|
||||
|
||||
VOLUME ["/site/content"]
|
||||
|
||||
+18
-34
@@ -1,50 +1,34 @@
|
||||
.PHONY: all default docs docs-build docs-shell shell test
|
||||
# to allow `make DOCSDIR=1 docs-shell` (to create a bind mount in docs)
|
||||
DOCS_MOUNT := $(if $(DOCSDIR),-v $(CURDIR):/docs/content/grafana/)
|
||||
.PHONY: all default docs docs-build docs-shell shell checkvars
|
||||
|
||||
# to allow `make DOCSPORT=9000 docs`
|
||||
DOCSPORT := 3004
|
||||
|
||||
# Get the IP ADDRESS
|
||||
DOCKER_IP=$(shell python -c "import urlparse ; print urlparse.urlparse('$(DOCKER_HOST)').hostname or ''")
|
||||
HUGO_BASE_URL=$(shell test -z "$(DOCKER_IP)" && echo localhost || echo "$(DOCKER_IP)")
|
||||
HUGO_BIND_IP=0.0.0.0
|
||||
|
||||
GIT_BRANCH := $(shell git rev-parse --abbrev-ref HEAD 2>/dev/null)
|
||||
GIT_BRANCH_CLEAN := $(shell echo $(GIT_BRANCH) | sed -e "s/[^[:alnum:]]/-/g")
|
||||
DOCKER_DOCS_IMAGE := grafana/grafana-docs
|
||||
|
||||
DOCKER_RUN_DOCS := docker run --rm -it $(DOCS_MOUNT) -e AWS_S3_BUCKET -e NOCACHE
|
||||
SOURCES_HOST_DIR := "$(shell pwd)/sources"
|
||||
|
||||
# for some docs workarounds (see below in "docs-build" target)
|
||||
GITCOMMIT := $(shell git rev-parse --short HEAD 2>/dev/null)
|
||||
DOCS_MOUNT := -v $(SOURCES_HOST_DIR):/site/content
|
||||
|
||||
DOCKER_RUN_DOCS := docker run --rm -it $(DOCS_MOUNT) -e NOCACHE -p 3004:3004 -p 3005:3005
|
||||
|
||||
VERSION := $(shell head -n 1 VERSION)
|
||||
|
||||
default: docs
|
||||
|
||||
checkvars:
|
||||
ifndef ENV
|
||||
$(error ENV is undefined set via ENV=staging or ENV=prod as argument to make)
|
||||
endif
|
||||
|
||||
docs: docs-build
|
||||
$(DOCKER_RUN_DOCS) -p 3004:3004 -p 3005:3005 -e DOCKERHOST "$(DOCKER_DOCS_IMAGE)" /bin/bash -c "grunt && grunt connect --port=3004"
|
||||
$(DOCKER_RUN_DOCS) $(DOCS_MOUNT) -e DOCKERHOST "$(DOCKER_DOCS_IMAGE)" /bin/bash -c "grunt --env=dev-docs && grunt connect --port=3004"
|
||||
|
||||
docs-watch: docs-build
|
||||
$(DOCKER_RUN_DOCS) -p 3004:3004 -p 3005:3005 -v $(SOURCES_HOST_DIR):/site/content -e DOCKERHOST "$(DOCKER_DOCS_IMAGE)" /bin/bash -c "grunt --env=dev-docs && grunt connect --port=3004 & grunt watch --port=3004 --env=dev-docs"
|
||||
watch: docs-build
|
||||
$(DOCKER_RUN_DOCS) $(DOCS_MOUNT) -e DOCKERHOST "$(DOCKER_DOCS_IMAGE)" /bin/bash -c "grunt --env=dev-docs && grunt connect --port=3004 & grunt watch --port=3004 --env=dev-docs"
|
||||
|
||||
docs-watch-mac: docs-build
|
||||
$(DOCKER_RUN_DOCS) -p 3004:3004 -p 3005:3005 -v $(SOURCES_HOST_DIR):/site/content -e DOCKERHOST "$(DOCKER_DOCS_IMAGE)" /bin/bash -c "grunt --env=dev-docs-mac && grunt connect --port=3004 & grunt watch --port=3004 --env=dev-docs-mac"
|
||||
|
||||
publish: docs-build
|
||||
$(DOCKER_RUN_DOCS) "$(DOCKER_DOCS_IMAGE)" /bin/bash -c "./publish.sh staging-docs v3.1"
|
||||
|
||||
publish-prod: docs-build
|
||||
$(DOCKER_RUN_DOCS) "$(DOCKER_DOCS_IMAGE)" /bin/bash -c "./publish.sh prod-docs root"
|
||||
|
||||
docs-draft: docs-build
|
||||
$(DOCKER_RUN_DOCS) -p $(if $(DOCSPORT),$(DOCSPORT):)8000 -e DOCKERHOST "$(DOCKER_DOCS_IMAGE)" hugo server --buildDrafts="true" --port=$(DOCSPORT) --baseUrl=$(HUGO_BASE_URL) --bind=$(HUGO_BIND_IP)
|
||||
|
||||
docs-shell: docs-build
|
||||
$(DOCKER_RUN_DOCS) -p $(if $(DOCSPORT),$(DOCSPORT):)8000 "$(DOCKER_DOCS_IMAGE)" bash
|
||||
|
||||
test: docs-build
|
||||
$(DOCKER_RUN_DOCS) -p $(if $(DOCSPORT),$(DOCSPORT):)8000 "$(DOCKER_DOCS_IMAGE)"
|
||||
publish: checkvars docs-build
|
||||
$(info Publishing ENV=${ENV} and VERSION=${VERSION})
|
||||
$(DOCKER_RUN_DOCS) $(DOCS_MOUNT) -e DOCKERHOST "$(DOCKER_DOCS_IMAGE)" /bin/bash -c "./publish.sh ${ENV}-docs ${VERSION}"
|
||||
|
||||
docs-build:
|
||||
docker build -t "$(DOCKER_DOCS_IMAGE)" .
|
||||
docker build -t "$(DOCKER_DOCS_IMAGE)" --no-cache .
|
||||
|
||||
+1
-1
@@ -1 +1 @@
|
||||
3.1.0
|
||||
v4.2
|
||||
|
||||
+11
-61
@@ -1,70 +1,20 @@
|
||||
|
||||
baseurl = "http://localhost:3002/"
|
||||
languageCode = "en-us"
|
||||
title = "Grafana Docs"
|
||||
canonifyurls = false
|
||||
title = "Grafana Documentation"
|
||||
canonifyurls = true
|
||||
relativeURLs = false
|
||||
verbose = true
|
||||
enableRobotsTXT = true
|
||||
disableSitemap = false
|
||||
disableRSS = true
|
||||
|
||||
[[menu.top]]
|
||||
name = "Docs"
|
||||
url = ""
|
||||
weight = 1
|
||||
|
||||
[[menu.top]]
|
||||
name = "Community"
|
||||
url = "/community"
|
||||
weight = 2
|
||||
|
||||
[[menu.top]]
|
||||
name = "Support"
|
||||
url = "/support"
|
||||
weight = 3
|
||||
|
||||
[[menu.top]]
|
||||
name = "Plugins"
|
||||
url = "https://grafana.net/plugins"
|
||||
weight = 4
|
||||
|
||||
[[menu.top]]
|
||||
name = "Dashboards"
|
||||
url = "https://grafana.net/dashboards"
|
||||
weight = 5
|
||||
|
||||
[[menu.top]]
|
||||
name = "Hosting"
|
||||
url = "/hosting"
|
||||
weight = 6
|
||||
|
||||
[[menu.top]]
|
||||
name = "Github"
|
||||
url = "https://github.com/grafana/grafana"
|
||||
weight = 7
|
||||
|
||||
## Main
|
||||
[[menu.main]]
|
||||
name = "Feature Gallery"
|
||||
url = "/features"
|
||||
weight = 1
|
||||
|
||||
[[menu.main]]
|
||||
name = "Live Demo"
|
||||
url = "http://play.grafana.org"
|
||||
weight = 2
|
||||
|
||||
[[menu.main]]
|
||||
name = "Download"
|
||||
url = "/download"
|
||||
weight = 3
|
||||
|
||||
[[menu.main]]
|
||||
name = "Blog"
|
||||
url = "/blog"
|
||||
weight = 4
|
||||
|
||||
|
||||
disableRSS = false
|
||||
preservetaxonomynames = true
|
||||
metaDataFormat = "yaml"
|
||||
|
||||
[taxonomies]
|
||||
tag = "tags"
|
||||
category = "categories"
|
||||
|
||||
[permalinks]
|
||||
blog = ":year/:month/:day/:title/"
|
||||
|
||||
|
||||
Executable
+3
@@ -0,0 +1,3 @@
|
||||
#!/bin/bash
|
||||
|
||||
make publish ENV=prod VERSION=root
|
||||
@@ -27,6 +27,24 @@ To show all admin commands:
|
||||
|
||||
### Reset admin password
|
||||
|
||||
You can reset the password for the admin user using the CLI.
|
||||
You can reset the password for the admin user using the CLI. The use case for this command is when you have lost the admin password.
|
||||
|
||||
`grafana-cli admin reset-admin-password ...`
|
||||
|
||||
If running the command returns this error:
|
||||
|
||||
> Could not find config defaults, make sure homepath command line parameter is set or working directory is homepath
|
||||
|
||||
then there are two flags that can be used to set homepath and the config file path.
|
||||
|
||||
`grafana-cli admin reset-admin-password --homepath "/usr/share/grafana" newpass`
|
||||
|
||||
If you have not lost the admin password then it is better to set in the Grafana UI. If you need to set the password in a script then the [Grafana API](http://docs.grafana.org/http_api/user/#change-password) can be used. Here is an example with curl using basic auth:
|
||||
|
||||
```
|
||||
curl -X PUT -H "Content-Type: application/json" -d '{
|
||||
"oldPassword": "admin",
|
||||
"newPassword": "newpass",
|
||||
"confirmNew": "newpass"
|
||||
}' http://admin:admin@<your_grafana_host>:3000/api/user/password
|
||||
```
|
||||
|
||||
@@ -12,18 +12,18 @@ weight = 2
|
||||
|
||||
# Alert Notifications
|
||||
|
||||
{{< imgbox max-width="40%" img="/img/docs/v4/alert_notifications_menu.png" caption="Alerting notifications" >}}
|
||||
|
||||
> Alerting is only available in Grafana v4.0 and above.
|
||||
|
||||
When an alert changes state it sends out notifications. Each alert rule can have
|
||||
multiple notifications. But in order to add a notification to an alert rule you first need
|
||||
to add and configure a `notification` object. This is done from the Alerting/Notifications page.
|
||||
to add and configure a `notification` channel (can be email, Pagerduty or other integration). This is done from the Notification Channels page.
|
||||
|
||||
## Notification Setup
|
||||
## Notification Channel Setup
|
||||
|
||||
On the notifications list page hit the `New Notification` button to go the the page where you
|
||||
can configure and setup a new notification.
|
||||
{{< imgbox max-width="40%" img="/img/docs/v43/alert_notifications_menu.png" caption="Alerting Notification Channels" >}}
|
||||
|
||||
On the Notification Channels page hit the `New Channel` button to go the the page where you
|
||||
can configure and setup a new Notification Channel.
|
||||
|
||||
You specify name and type, and type specific options. You can also test the notification to make
|
||||
sure it's working and setup correctly.
|
||||
@@ -32,15 +32,15 @@ sure it's working and setup correctly.
|
||||
|
||||
When checked this option will make this notification used for all alert rules, existing and new.
|
||||
|
||||
## Supported notification types
|
||||
## Supported Notification Types
|
||||
|
||||
Grafana ships with a set of notification types. More will be added in future releases.
|
||||
Grafana ships with the following set of notification types:
|
||||
|
||||
### Email
|
||||
|
||||
To enable email notification you have to setup [SMTP settings](/installation/configuration/#smtp)
|
||||
in the Grafana config. Email notification will upload an image of the alert graph to an
|
||||
external image destination if available or fallback on attaching the image in the email.
|
||||
external image destination if available or fallback to attaching the image in the email.
|
||||
|
||||
### Slack
|
||||
|
||||
@@ -55,19 +55,29 @@ Setting | Description
|
||||
Recipient | allows you to override the slack recipient.
|
||||
Mention | make it possible to include a mention in the slack notification sent by Grafana. Ex @here or @channel
|
||||
|
||||
### PagerDuty
|
||||
|
||||
To set up PagerDuty, all you have to do is to provide an api key.
|
||||
|
||||
Setting | Description
|
||||
---------- | -----------
|
||||
Integration Key | Integration key for pagerduty.
|
||||
Auto resolve incidents | Resolve incidents in pagerduty once the alert goes back to ok
|
||||
|
||||
### Webhook
|
||||
|
||||
The webhook notification is a simple way to send information about an state change over HTTP to a custom endpoint.
|
||||
Using this notification you could integrated Grafana into any system you choose, by yourself.
|
||||
Using this notification you could integrate Grafana into any system you choose, by yourself.
|
||||
|
||||
Example json body:
|
||||
|
||||
```json
|
||||
{
|
||||
"title": "My alert",
|
||||
"ruleId": 1,
|
||||
"ruleName": "Load peaking!",
|
||||
"ruleUrl": "http://url.to.grafana/db/dashboard/my_dashboard?panelId=2",
|
||||
"state": "Alerting",
|
||||
"state": "alerting",
|
||||
"imageUrl": "http://s3.image.url",
|
||||
"message": "Load is peaking. Make sure the traffic is real and spin up more webfronts",
|
||||
"evalMatches": [
|
||||
@@ -80,30 +90,38 @@ Example json body:
|
||||
}
|
||||
```
|
||||
|
||||
### PagerDuty
|
||||
- **state** - The possible values for alert state are: `ok`, `paused`, `alerting`, `pending`, `no_data`.
|
||||
|
||||
To set up PagerDuty, all you have to do is to provide an api key.
|
||||
### Other Supported Notification Channels
|
||||
|
||||
Setting | Description
|
||||
---------- | -----------
|
||||
Integration Key | Integration key for pagerduty.
|
||||
Auto resolve incidents | Resolve incidents in pagerduty once the alert goes back to ok
|
||||
Grafana also supports the following Notification Channels:
|
||||
|
||||
- HipChat
|
||||
|
||||
- VictorOps
|
||||
|
||||
- Sensu
|
||||
|
||||
- OpsGenie
|
||||
|
||||
- Threema
|
||||
|
||||
- Pushover
|
||||
|
||||
- Telegram
|
||||
|
||||
- LINE
|
||||
|
||||
# Enable images in notifications {#external-image-store}
|
||||
|
||||
Grafana can render the panel associated with the alert rule and include that in the notification. Some types
|
||||
of notifications require that this image be publicly accessable (Slack for example). In order to support
|
||||
images in notifications like Slack Grafana can upload the image to an image store. It currently supports
|
||||
Amazon S3 for this and Webdav. So to set that up you need to configure the
|
||||
[external image uploader](/installation/configuration/#external-image-storage) in your grafana-server ini
|
||||
config file.
|
||||
Grafana can render the panel associated with the alert rule and include that in the notification. Most Notification Channels require that this image be publicly accessable (Slack and PagerDuty for example). In order to include images in alert notifications, Grafana can upload the image to an image store. It currently supports
|
||||
Amazon S3 and Webdav for this. So to set that up you need to configure the [external image uploader](/installation/configuration/#external-image-storage) in your grafana-server ini config file.
|
||||
|
||||
This is an optional requirement, you can get slack and email notifications without setting this up.
|
||||
Currently only the Email Channels attaches images if no external image store is specified. To include images in alert notifications for other channels then you need to set up an external image store.
|
||||
|
||||
This is an optional requirement, you can get Slack and email notifications without setting this up.
|
||||
|
||||
# Configure the link back to Grafana from alert notifications
|
||||
|
||||
All alert notifications contains a link back to the triggered alert in the Grafana instance.
|
||||
This url is based on the [domain](/installation/configuration/#domain) setting in Grafana.
|
||||
|
||||
|
||||
All alert notifications contains a link back to the triggered alert in the Grafana instance.
|
||||
This url is based on the [domain](/installation/configuration/#domain) setting in Grafana.
|
||||
|
||||
@@ -12,10 +12,7 @@ weight = 200
|
||||
Here you can find links to older versions of the documentation that might be better suited for your version
|
||||
of Grafana.
|
||||
|
||||
- [Latest](/)
|
||||
- [Version 3.1](/v3.1)
|
||||
- [Version 3.0](/v3.0)
|
||||
- [Version 2.6](/v2.6)
|
||||
- [Version 2.5](/v2.5)
|
||||
- [Version 2.1](/v2.1)
|
||||
- [Version 2.0](/v2.0)
|
||||
- [Latest](http://docs.grafana.org)
|
||||
- [Version 4.2](http://docs.grafana.org/v4.2)
|
||||
- [Version 3.1](http://docs.grafana.org/v3.1)
|
||||
- [Version 3.0](http://docs.grafana.org/v3.0)
|
||||
|
||||
@@ -2,7 +2,7 @@
|
||||
title = "Contributor Licence Agreement (CLA)"
|
||||
description = "Contributer Licence Agreement (CLA)"
|
||||
type = "docs"
|
||||
aliases = ["/project/cla"]
|
||||
aliases = ["/project/cla", "docs/contributing/cla.html"]
|
||||
[menu.docs]
|
||||
parent = "contribute"
|
||||
weight = 1
|
||||
|
||||
@@ -13,29 +13,26 @@ weight = 10
|
||||
|
||||
# Using AWS CloudWatch in Grafana
|
||||
|
||||
Grafana ships with built in support for CloudWatch. You just have to add it as a data source and you will
|
||||
be ready to build dashboards for you CloudWatch metrics.
|
||||
Grafana ships with built in support for CloudWatch. You just have to add it as a data source and you will be ready to build dashboards for you CloudWatch metrics.
|
||||
|
||||
## Adding the data source
|
||||

|
||||
## Adding the data source to Grafana
|
||||
|
||||
1. Open the side menu by clicking the the Grafana icon in the top header.
|
||||
1. Open the side menu by clicking the Grafana icon in the top header.
|
||||
2. In the side menu under the `Dashboards` link you should find a link named `Data Sources`.
|
||||
3. Click the `+ Add data source` button in the top header.
|
||||
4. Select `Cloudwatch` from the *Type* dropdown.
|
||||
|
||||
> NOTE: If this link is missing in the side menu it means that your current user does not have the `Admin` role for the current organization.
|
||||
|
||||
3. Click the `Add new` link in the top header.
|
||||
4. Select `CloudWatch` from the dropdown.
|
||||
> NOTE: If at any moment you have issues with getting this datasource to work and grafana is giving you undescriptive errors then dont forget to check your log file (try looking in /var/log/grafana/).
|
||||
> NOTE: If at any moment you have issues with getting this datasource to work and Grafana is giving you undescriptive errors then don't
|
||||
forget to check your log file (try looking in /var/log/grafana/grafana.log).
|
||||
|
||||
Name | Description
|
||||
------------ | -------------
|
||||
Name | The data source name, important that this is the same as in Grafana v1.x if you plan to import old dashboards.
|
||||
Default | Default data source means that it will be pre-selected for new panels.
|
||||
Credentials profile name | Specify the name of the profile to use (if you use `~/aws/credentials` file), leave blank for default. This option was introduced in Grafana 2.5.1
|
||||
Default Region | Used in query editor to set region (can be changed on per query basis)
|
||||
Custom Metrics namespace | Specify the CloudWatch namespace of Custom metrics
|
||||
Assume Role Arn | Specify the ARN of the role to assume
|
||||
*Name* | The data source name. This is how you refer to the data source in panels & queries.
|
||||
*Default* | Default data source means that it will be pre-selected for new panels.
|
||||
*Credentials* profile name | Specify the name of the profile to use (if you use `~/aws/credentials` file), leave blank for default.
|
||||
*Default Region* | Used in query editor to set region (can be changed on per query basis)
|
||||
*Custom Metrics namespace* | Specify the CloudWatch namespace of Custom metrics
|
||||
*Assume Role Arn* | Specify the ARN of the role to assume
|
||||
|
||||
## Authentication
|
||||
|
||||
@@ -61,49 +58,64 @@ Example content:
|
||||
|
||||
## Metric Query Editor
|
||||
|
||||

|
||||

|
||||
|
||||
You need to specify a namespace, metric, at least one stat, and at least one dimension.
|
||||
|
||||
## Templated queries
|
||||
CloudWatch Datasource Plugin provides the following functions in `Variables values query` field in Templating Editor to query `region`, `namespaces`, `metric names` and `dimension keys/values` on the CloudWatch.
|
||||
|
||||
Instead of hard-coding things like server, application and sensor name in you metric queries you can use variables in their place.
|
||||
Variables are shown as dropdown select boxes at the top of the dashboard. These dropdowns makes it easy to change the data
|
||||
being displayed in your dashboard.
|
||||
|
||||
Checkout the [Templating]({{< relref "reference/templating.md" >}}) documentation for an introduction to the templating feature and the different
|
||||
types of template variables.
|
||||
|
||||
### Query variable
|
||||
|
||||
CloudWatch Datasource Plugin provides the following queries you can specify in the `Query` field in the Variable
|
||||
edit view. They allow you to fill a variable's options list with things like `region`, `namespaces`, `metric names`
|
||||
and `dimension keys/values`.
|
||||
|
||||
Name | Description
|
||||
------- | --------
|
||||
`regions()` | Returns a list of regions AWS provides their service.
|
||||
`namespaces()` | Returns a list of namespaces CloudWatch support.
|
||||
`metrics(namespace, [region])` | Returns a list of metrics in the namespace. (specify region for custom metrics)
|
||||
`dimension_keys(namespace)` | Returns a list of dimension keys in the namespace.
|
||||
`dimension_values(region, namespace, metric, dimension_key)` | Returns a list of dimension values matching the specified `region`, `namespace`, `metric` and `dimension_key`.
|
||||
`ebs_volume_ids(region, instance_id)` | Returns a list of volume id matching the specified `region`, `instance_id`.
|
||||
`ec2_instance_attribute(region, attribute_name, filters)` | Returns a list of attribute matching the specified `region`, `attribute_name`, `filters`.
|
||||
*regions()* | Returns a list of regions AWS provides their service.
|
||||
*namespaces()* | Returns a list of namespaces CloudWatch support.
|
||||
*metrics(namespace, [region])* | Returns a list of metrics in the namespace. (specify region for custom metrics)
|
||||
*dimension_keys(namespace)* | Returns a list of dimension keys in the namespace.
|
||||
*dimension_values(region, namespace, metric, dimension_key)* | Returns a list of dimension values matching the specified `region`, `namespace`, `metric` and `dimension_key`.
|
||||
*ebs_volume_ids(region, instance_id)* | Returns a list of volume id matching the specified `region`, `instance_id`.
|
||||
*ec2_instance_attribute(region, attribute_name, filters)* | Returns a list of attribute matching the specified `region`, `attribute_name`, `filters`.
|
||||
|
||||
For details about the metrics CloudWatch provides, please refer to the [CloudWatch documentation](https://docs.aws.amazon.com/AmazonCloudWatch/latest/DeveloperGuide/CW_Support_For_AWS.html).
|
||||
|
||||
## Example templated Queries
|
||||
#### Examples templated Queries
|
||||
|
||||
Example dimension queries which will return list of resources for individual AWS Services:
|
||||
|
||||
Service | Query
|
||||
Query | Service
|
||||
------- | -----
|
||||
ELB | `dimension_values(us-east-1,AWS/ELB,RequestCount,LoadBalancerName)`
|
||||
ElastiCache | `dimension_values(us-east-1,AWS/ElastiCache,CPUUtilization,CacheClusterId)`
|
||||
RedShift | `dimension_values(us-east-1,AWS/Redshift,CPUUtilization,ClusterIdentifier)`
|
||||
RDS | `dimension_values(us-east-1,AWS/RDS,CPUUtilization,DBInstanceIdentifier)`
|
||||
S3 | `dimension_values(us-east-1,AWS/S3,BucketSizeBytes,BucketName)`
|
||||
*dimension_values(us-east-1,AWS/ELB,RequestCount,LoadBalancerName)* | ELB
|
||||
*dimension_values(us-east-1,AWS/ElastiCache,CPUUtilization,CacheClusterId)* | ElastiCache
|
||||
*dimension_values(us-east-1,AWS/Redshift,CPUUtilization,ClusterIdentifier)* | RedShift
|
||||
*dimension_values(us-east-1,AWS/RDS,CPUUtilization,DBInstanceIdentifier)* | RDS
|
||||
*dimension_values(us-east-1,AWS/S3,BucketSizeBytes,BucketName)* | S3
|
||||
|
||||
## ec2_instance_attribute JSON filters
|
||||
#### ec2_instance_attribute JSON filters
|
||||
|
||||
The `ec2_instance_attribute` query take `filters` in JSON format.
|
||||
You can specify [pre-defined filters of ec2:DescribeInstances](http://docs.aws.amazon.com/AWSEC2/latest/APIReference/API_DescribeInstances.html).
|
||||
Specify like `{ filter_name1: [ filter_value1 ], filter_name2: [ filter_value2 ] }`
|
||||
|
||||
Filters syntax:
|
||||
|
||||
```javascript
|
||||
{ filter_name1: [ filter_value1 ], filter_name2: [ filter_value2 ] }
|
||||
```
|
||||
|
||||
Example `ec2_instance_attribute()` query
|
||||
|
||||
ec2_instance_attribute(us-east-1, InstanceId, { "tag:Environment": [ "production" ] })
|
||||
|
||||

|
||||
|
||||
## Cost
|
||||
|
||||
Amazon provides 1 million CloudWatch API requests each month at no additional charge. Past this,
|
||||
|
||||
@@ -12,34 +12,29 @@ weight = 3
|
||||
|
||||
# Using Elasticsearch in Grafana
|
||||
|
||||
Grafana ships with advanced support for Elasticsearch. You can do many types of
|
||||
simple or complex elasticsearch queries to visualize logs or metrics stored in elasticsearch. You can
|
||||
also annotate your graphs with log events stored in elasticsearch.
|
||||
Grafana ships with advanced support for Elasticsearch. You can do many types of simple or complex Elasticsearch queries to
|
||||
visualize logs or metrics stored in Elasticsearch. You can also annotate your graphs with log events stored in Elasticsearch.
|
||||
|
||||
## Adding the data source
|
||||
|
||||

|
||||
|
||||
1. Open the side menu by clicking the the Grafana icon in the top header.
|
||||
1. Open the side menu by clicking the Grafana icon in the top header.
|
||||
2. In the side menu under the `Dashboards` link you should find a link named `Data Sources`.
|
||||
3. Click the `+ Add data source` button in the top header.
|
||||
4. Select *Elasticsearch* from the *Type* dropdown.
|
||||
|
||||
> NOTE: If this link is missing in the side menu it means that your current user does not have the `Admin` role for the current organization.
|
||||
|
||||
3. Click the `Add new` link in the top header.
|
||||
4. Select `Elasticsearch` from the dropdown.
|
||||
> NOTE: If you're not seeing the `Data Sources` link in your side menu it means that your current user does not have the `Admin` role for the current organization.
|
||||
|
||||
Name | Description
|
||||
------------ | -------------
|
||||
Name | The data source name, important that this is the same as in Grafana v1.x if you plan to import old dashboards.
|
||||
Default | Default data source means that it will be pre-selected for new panels.
|
||||
Url | The http protocol, ip and port of you elasticsearch server.
|
||||
Access | Proxy = access via Grafana backend, Direct = access directly from browser.
|
||||
*Name* | The data source name. This is how you refer to the data source in panels & queries.
|
||||
*Default* | Default data source means that it will be pre-selected for new panels.
|
||||
*Url* | The HTTP protocol, IP, and port of your Elasticsearch server.
|
||||
*Access* | Proxy = access via Grafana backend, Direct = access directly from browser.
|
||||
|
||||
Proxy access means that the Grafana backend will proxy all requests from the browser, and send them on to the Data Source. This is useful because it can eliminate CORS (Cross Origin Site Resource) issues, as well as eliminate the need to disseminate authentication details to the Data Source to the browser.
|
||||
|
||||
Direct access is still supported because in some cases it may be useful to access a Data Source directly depending on the use case and topology of Grafana, the user, and the Data Source.
|
||||
Proxy access means that the Grafana backend will proxy all requests from the browser, and send them on to the Data Source. This is useful because it can eliminate CORS (Cross Origin Site Resource) issues, as well as eliminate the need to disseminate authentication to the browser.
|
||||
|
||||
### Direct access
|
||||
|
||||
If you select direct access you must update your Elasticsearch configuration to allow other domains to access
|
||||
Elasticsearch from the browser. You do this by specifying these to options in your **elasticsearch.yml** config file.
|
||||
|
||||
@@ -50,46 +45,93 @@ Elasticsearch from the browser. You do this by specifying these to options in yo
|
||||
|
||||

|
||||
|
||||
Here you can specify a default for the `time field` and specify the name of your elasticsearch index. You can use
|
||||
Here you can specify a default for the `time field` and specify the name of your Elasticsearch index. You can use
|
||||
a time pattern for the index name or a wildcard.
|
||||
|
||||
### Elasticsearch version
|
||||
|
||||
Be sure to specify your Elasticsearch version in the version selection dropdown. This is very important as there are differences how queries are composed. Currently only 2.x and 5.x
|
||||
are supported.
|
||||
|
||||
## Metric Query editor
|
||||
|
||||

|
||||
|
||||
The Elasticsearch query editor allows you to select multiple metrics and group by multiple terms or filters. Use the plus and minus icons to the right to add / remove
|
||||
metrics or group bys. Some metrics and group by have options, click the option text to expand the the row to view and edit metric or group by options.
|
||||
The Elasticsearch query editor allows you to select multiple metrics and group by multiple terms or filters. Use the plus and minus icons to the right to add/remove
|
||||
metrics or group by clauses. Some metrics and group by clauses haves options, click the option text to expand the row to view and edit metric or group by options.
|
||||
|
||||
## Series naming & alias patterns
|
||||
|
||||
You can control the name for time series via the `Alias` input field.
|
||||
|
||||
Pattern | Description
|
||||
------------ | -------------
|
||||
*{{term fieldname}}* | replaced with value of a term group by
|
||||
*{{metric}}* | replaced with metric name (ex. Average, Min, Max)
|
||||
*{{field}}* | replaced with the metric field name
|
||||
|
||||
## Pipeline metrics
|
||||
|
||||
If you have Elasticsearch 2.x and Grafana 2.6 or above then you can use pipeline metric aggregations like
|
||||
**Moving Average** and **Derivative**. Elasticsearch pipeline metrics require another metric to be based on. Use the eye icon next to the metric
|
||||
to hide metrics from appearing in the graph. This is useful for metrics you only have in the query to be used
|
||||
in a pipeline metric.
|
||||
Some metric aggregations are called Pipeline aggregations, for example, *Moving Average* and *Derivative*. Elasticsearch pipeline metrics require another metric to be based on. Use the eye icon next to the metric to hide metrics from appearing in the graph. This is useful for metrics you only have in the query for use in a pipeline metric.
|
||||
|
||||

|
||||
|
||||
## Templating
|
||||
|
||||
The Elasticsearch datasource supports two types of queries you can use to fill template variables with values.
|
||||
Instead of hard-coding things like server, application and sensor name in you metric queries you can use variables in their place.
|
||||
Variables are shown as dropdown select boxes at the top of the dashboard. These dropdowns makes it easy to change the data
|
||||
being displayed in your dashboard.
|
||||
|
||||
### Possible values for a field
|
||||
Checkout the [Templating]({{< relref "reference/templating.md" >}}) documentation for an introduction to the templating feature and the different
|
||||
types of template variables.
|
||||
|
||||
```json
|
||||
{"find": "terms", "field": "@hostname"}
|
||||
### Query variable
|
||||
|
||||
The Elasticsearch data source supports two types of queries you can use in the *Query* field of *Query* variables. The query is written using a custom JSON string.
|
||||
|
||||
Query | Description
|
||||
------------ | -------------
|
||||
*{"find": "fields", "type": "keyword"} | Returns a list of field names with the index type `keyword`.
|
||||
*{"find": "terms", "field": "@hostname"}* | Returns a list of values for a field using term aggregation. Query will user current dashboard time range as time range for query.
|
||||
*{"find": "terms", "field": "@hostname", "query": '<lucene query>'}* | Returns a list of values for a field using term aggregation & and a specified lucene query filter. Query will use current dashboard time range as time range for query.
|
||||
|
||||
You can use other variables inside the query. Example query definition for a variable named `$host`.
|
||||
|
||||
```
|
||||
{"find": "terms", "field": "@hostname", "query": "@source:$source"}
|
||||
```
|
||||
|
||||
### Fields filtered by type
|
||||
```json
|
||||
{"find": "fields", "type": "string"}
|
||||
```
|
||||
In the above example, we use another variable named `$source` inside the query definition. Whenever you change, via the dropdown, the current value of the ` $source` variable, it will trigger an update of the `$host` variable so it now only contains hostnames filtered by in this case the
|
||||
`@source` document property.
|
||||
|
||||
### Fields filtered by type, with filter
|
||||
```json
|
||||
{"find": "fields", "type": "string", "query": <lucene query>}
|
||||
```
|
||||
### Using variables in queries
|
||||
|
||||
### Multi format / All format
|
||||
Use lucene format.
|
||||
There are two syntaxes:
|
||||
|
||||
- `$<varname>` Example: @hostname:$hostname
|
||||
- `[[varname]]` Example: @hostname:[[hostname]]
|
||||
|
||||
Why two ways? The first syntax is easier to read and write but does not allow you to use a variable in the middle of a word. When the *Multi-value* or *Include all value*
|
||||
options are enabled, Grafana converts the labels from plain text to a lucene compatible condition.
|
||||
|
||||

|
||||
|
||||
In the above example, we have a lucene query that filters documents based on the `@hostname` property using a variable named `$hostname`. It is also using
|
||||
a variable in the *Terms* group by field input box. This allows you to use a variable to quickly change how the data is grouped.
|
||||
|
||||
Example dashboard:
|
||||
[Elasticsearch Templated Dashboard](http://play.grafana.org/dashboard/db/elasticsearch-templated)
|
||||
|
||||
## Annotations
|
||||
|
||||
[Annotations]({{< relref "reference/annotations.md" >}}) allows you to overlay rich event information on top of graphs. You add annotation
|
||||
queries via the Dashboard menu / Annotations view. Grafana can query any Elasticsearch index
|
||||
for annotation events.
|
||||
|
||||
Name | Description
|
||||
------------ | -------------
|
||||
Query | You can leave the search query blank or specify a lucene query
|
||||
Time | The name of the time field, needs to be date field.
|
||||
Title | The name of the field to use for the event title.
|
||||
Tags | Optional field name to use for event tags (can be an array or a CSV string).
|
||||
Text | Optional field name to use event text body.
|
||||
|
||||
@@ -18,28 +18,22 @@ change function parameters and much more. The editor can handle all types of gra
|
||||
queries through the use of query references.
|
||||
|
||||
## Adding the data source
|
||||

|
||||
|
||||
1. Open the side menu by clicking the the Grafana icon in the top header.
|
||||
1. Open the side menu by clicking the Grafana icon in the top header.
|
||||
2. In the side menu under the `Dashboards` link you should find a link named `Data Sources`.
|
||||
3. Click the `+ Add data source` button in the top header.
|
||||
4. Select `Graphite` from the *Type* dropdown.
|
||||
|
||||
> NOTE: If this link is missing in the side menu it means that your current user does not have the `Admin` role for the current organization.
|
||||
|
||||
3. Click the `Add new` link in the top header.
|
||||
4. Select `Graphite` from the dropdown.
|
||||
> NOTE: If you're not seeing the `Data Sources` link in your side menu it means that your current user does not have the `Admin` role for the current organization.
|
||||
|
||||
Name | Description
|
||||
------------ | -------------
|
||||
Name | The data source name, important that this is the same as in Grafana v1.x if you plan to import old dashboards.
|
||||
Default | Default data source means that it will be pre-selected for new panels.
|
||||
Url | The http protocol, ip and port of your graphite-web or graphite-api install.
|
||||
Access | Proxy = access via Grafana backend, Direct = access directly from browser.
|
||||
|
||||
|
||||
Proxy access means that the Grafana backend will proxy all requests from the browser, and send them on to the Data Source. This is useful because it can eliminate CORS (Cross Origin Site Resource) issues, as well as eliminate the need to disseminate authentication details to the Data Source to the browser.
|
||||
|
||||
Direct access is still supported because in some cases it may be useful to access a Data Source directly depending on the use case and topology of Grafana, the user, and the Data Source.
|
||||
*Name* | The data source name. This is how you refer to the data source in panels & queries.
|
||||
*Default* | Default data source means that it will be pre-selected for new panels.
|
||||
*Url* | The HTTP protocol, IP, and port of your graphite-web or graphite-api install.
|
||||
*Access* | Proxy = access via Grafana backend, Direct = access directly from browser.
|
||||
|
||||
Proxy access means that the Grafana backend will proxy all requests from the browser, and send them on to the Data Source. This is useful because it can eliminate CORS (Cross Origin Site Resource) issues, as well as eliminate the need to disseminate authentication details to the browser.
|
||||
|
||||
## Metric editor
|
||||
|
||||
@@ -50,6 +44,7 @@ or keyboard arrow keys. You can select a wildcard and still continue.
|
||||

|
||||
|
||||
### Functions
|
||||
|
||||
Click the plus icon to the right to add a function. You can search for the function or select it from the menu. Once
|
||||
a function is selected it will be added and your focus will be in the text box of the first parameter. To later change
|
||||
a parameter just click on it and it will turn into a text box. To delete a function click the function name followed
|
||||
@@ -57,32 +52,61 @@ by the x icon.
|
||||
|
||||

|
||||
|
||||
|
||||
### Optional parameters
|
||||
|
||||
Some functions like aliasByNode support an optional second argument. To add this parameter specify for example 3,-2 as the first parameter and the function editor will adapt and move the -2 to a second parameter. To remove the second optional parameter just click on it and leave it blank and the editor will remove it.
|
||||
|
||||

|
||||
|
||||
### Nested Queries
|
||||
|
||||
You can reference queries by the row “letter” that they’re on (similar to Microsoft Excel). If you add a second query to a graph, you can reference the first query simply by typing in #A. This provides an easy and convenient way to build compounded queries.
|
||||
|
||||
## Point consolidation
|
||||
|
||||
All Graphite metrics are consolidated so that Graphite doesn't return more data points than there are pixels in the graph. By default
|
||||
All Graphite metrics are consolidated so that Graphite doesn't return more data points than there are pixels in the graph. By default,
|
||||
this consolidation is done using `avg` function. You can how Graphite consolidates metrics by adding the Graphite consolidateBy function.
|
||||
|
||||
> *Notice* This means that legend summary values (max, min, total) cannot be all correct at the same time. They are calculated
|
||||
> client side by Grafana. And depending on your consolidation function only one or two can be correct at the same time.
|
||||
|
||||
## Templating
|
||||
You can create a template variable in Grafana and have that variable filled with values from any Graphite metric exploration query.
|
||||
You can then use this variable in your Graphite queries, either as part of a metric path or as arguments to functions.
|
||||
|
||||
For example a query like `prod.servers.*` will fill the variable with all possible
|
||||
values that exists in the wildcard position.
|
||||
Instead of hard-coding things like server, application and sensor name in you metric queries you can use variables in their place.
|
||||
Variables are shown as dropdown select boxes at the top of the dashboard. These dropdowns makes it easy to change the data
|
||||
being displayed in your dashboard.
|
||||
|
||||
Checkout the [Templating]({{< relref "reference/templating.md" >}}) documentation for an introduction to the templating feature and the different
|
||||
types of template variables.
|
||||
|
||||
### Query variable
|
||||
|
||||
The query you specify in the query field should be a metric find type of query. For example, a query like `prod.servers.*` will fill the
|
||||
variable with all possible values that exist in the wildcard position.
|
||||
|
||||
You can also create nested variables that use other variables in their definition. For example
|
||||
`apps.$app.servers.*` uses the variable `$app` in its query definition.
|
||||
|
||||
### Variable usage
|
||||
|
||||
You can use a variable in a metric node path or as a parameter to a function.
|
||||

|
||||
|
||||
There are two syntaxes:
|
||||
|
||||
## Query Reference
|
||||
You can reference queries by the row “letter” that they’re on (similar to Microsoft Excel). If you add a second query to graph, you can reference the first query simply by typing in #A. This provides an easy and convenient way to build compounded queries.
|
||||
- `$<varname>` Example: apps.frontend.$server.requests.count
|
||||
- `[[varname]]` Example: apps.frontend.[[server]].requests.count
|
||||
|
||||
Why two ways? The first syntax is easier to read and write but does not allow you to use a variable in the middle of a word. Use
|
||||
the second syntax in expressions like `my.server[[serverNumber]].count`.
|
||||
|
||||
Example:
|
||||
[Graphite Templated Dashboard](http://play.grafana.org/dashboard/db/graphite-templated-nested)
|
||||
|
||||
## Annotations
|
||||
|
||||
[Annotations]({{< relref "reference/annotations.md" >}}) allows you to overlay rich event information on top of graphs. You add annotation
|
||||
queries via the Dashboard menu / Annotations view.
|
||||
|
||||
Graphite supports two ways to query annotations. A regular metric query, for this you use the `Graphite query` textbox. A Graphite events query, use the `Graphite event tags` textbox,
|
||||
specify a tag or wildcard (leave empty should also work)
|
||||
|
||||
@@ -30,5 +30,5 @@ The following datasources are officially supported:
|
||||
|
||||
## Data source plugins
|
||||
|
||||
Since grafana 3.0 you can install data sources as plugins. Checkout [Grafana.net](https://grafana.net/plugins) for more data sources.
|
||||
Since grafana 3.0 you can install data sources as plugins. Checkout [Grafana.net](https://grafana.com/plugins) for more data sources.
|
||||
|
||||
|
||||
@@ -15,29 +15,29 @@ weight = 3
|
||||
Grafana ships with very feature rich data source plugin for InfluxDB. Supporting a feature rich query editor, annotation and templating queries.
|
||||
|
||||
## Adding the data source
|
||||

|
||||
|
||||
1. Open the side menu by clicking the the Grafana icon in the top header.
|
||||
1. Open the side menu by clicking the Grafana icon in the top header.
|
||||
2. In the side menu under the `Dashboards` link you should find a link named `Data Sources`.
|
||||
3. Click the `+ Add data source` button in the top header.
|
||||
4. Select *InfluxDB* from the *Type* dropdown.
|
||||
|
||||
> NOTE: If this link is missing in the side menu it means that your current user does not have the `Admin` role for the current organization.
|
||||
|
||||
3. Click the `Add new` link in the top header.
|
||||
> NOTE: If you're not seeing the `Data Sources` link in your side menu it means that your current user does not have the `Admin` role for the current organization.
|
||||
|
||||
Name | Description
|
||||
------------ | -------------
|
||||
Name | The data source name, important that this is the same as in Grafana v1.x if you plan to import old dashboards.
|
||||
Default | Default data source means that it will be pre-selected for new panels.
|
||||
Url | The http protocol, ip and port of you influxdb api (influxdb api port is by default 8086)
|
||||
Access | Proxy = access via Grafana backend, Direct = access directly from browser.
|
||||
Database | Name of your influxdb database
|
||||
User | Name of your database user
|
||||
Password | Database user's password
|
||||
*Name* | The data source name. This is how you refer to the data source in panels & queries.
|
||||
*Default* | Default data source means that it will be pre-selected for new panels.
|
||||
*Url* | The http protocol, ip and port of you influxdb api (influxdb api port is by default 8086)
|
||||
*Access* | Proxy = access via Grafana backend, Direct = access directly from browser.
|
||||
*Database* | Name of your influxdb database
|
||||
*User* | Name of your database user
|
||||
*Password* | Database user's password
|
||||
|
||||
> Proxy access means that the Grafana backend will proxy all requests from the browser, and send them on to the Data Source. This is useful because it can eliminate CORS (Cross Origin Site Resource) issues, as well as eliminate the need to disseminate authentication details to the Data Source to the browser.
|
||||
|
||||
> Direct access is still supported because in some cases it may be useful to access a Data Source directly depending on the use case and topology of Grafana, the user, and the Data Source.
|
||||
### Proxy vs Direct access
|
||||
|
||||
Proxy access means that the Grafana backend will proxy all requests from the browser. So requests to InfluxDB will be channeled through
|
||||
`grafana-server`. This means that the URL you specify needs to be accessable from the server you are running Grafana on. Proxy access
|
||||
mode is also more secure as the username & password will never reach the browser.
|
||||
|
||||
## Query Editor
|
||||
|
||||
@@ -100,11 +100,21 @@ change the option `Format As` to `Table` if you want to show raw data in the `Ta
|
||||
|
||||
|
||||
## Templating
|
||||
You can create a template variable in Grafana and have that variable filled with values from any InfluxDB metric exploration query.
|
||||
You can then use this variable in your InfluxDB metric queries.
|
||||
|
||||
For example you can have a variable that contains all values for tag `hostname` if you specify a query like this
|
||||
in the templating edit view.
|
||||
Instead of hard-coding things like server, application and sensor name in you metric queries you can use variables in their place.
|
||||
Variables are shown as dropdown select boxes at the top of the dashboard. These dropdowns makes it easy to change the data
|
||||
being displayed in your dashboard.
|
||||
|
||||
Checkout the [Templating]({{< relref "reference/templating.md" >}}) documentation for an introduction to the templating feature and the different
|
||||
types of template variables.
|
||||
|
||||
### Query variable
|
||||
|
||||
If you add a template variable of the type `Query` you can write a InfluxDB exploration (meta data) query. These queries can
|
||||
return things like measurement names, key names or key values.
|
||||
|
||||
For example you can have a variable that contains all values for tag `hostname` if you specify a query like this in the templating variable *Query* setting.
|
||||
|
||||
```sql
|
||||
SHOW TAG VALUES WITH KEY = "hostname"
|
||||
```
|
||||
@@ -116,12 +126,46 @@ the hosts variable only show hosts from the current selected region with a query
|
||||
SHOW TAG VALUES WITH KEY = "hostname" WHERE region =~ /$region/
|
||||
```
|
||||
|
||||
> Always use `regex values` or `regex wildcard` for All format or multi select format.
|
||||
You can fetch key names for a given measurement.
|
||||
|
||||

|
||||
```sql
|
||||
SHOW TAG KEYS [FROM <measurement_name>]
|
||||
```
|
||||
|
||||
If you have a variable with key names you can use this variable in a group by clause. This will allow you to change group by using the variable dropdown a the top
|
||||
of the dashboard.
|
||||
|
||||
### Using variables in queries
|
||||
|
||||
There are two syntaxes:
|
||||
|
||||
`$<varname>` Example:
|
||||
|
||||
```sql
|
||||
SELECT mean("value") FROM "logins" WHERE "hostname" =~ /^$host$/ AND $timeFilter GROUP BY time($__interval), "hostname"
|
||||
```
|
||||
|
||||
`[[varname]]` Example:
|
||||
|
||||
```sql
|
||||
SELECT mean("value") FROM "logins" WHERE "hostname" =~ /^[[host]]$/ AND $timeFilter GROUP BY time($__interval), "hostname"
|
||||
```
|
||||
|
||||
Why two ways? The first syntax is easier to read and write but does not allow you to use a variable in the middle of a word. When the *Multi-value* or *Include all value*
|
||||
options are enabled, Grafana converts the labels from plain text to a regex compatible string. Which means you have to use `=~` instead of `=`.
|
||||
|
||||
Example Dashboard:
|
||||
[InfluxDB Templated Dashboard](http://play.grafana.org/dashboard/db/influxdb-templated-queries)
|
||||
|
||||
### Ad hoc filters variable
|
||||
|
||||
InfluxDB supports the special `Ad hoc filters` variable type. This variable allows you to specify any number of key/value filters on the fly. These filters will automatically
|
||||
be applied to all your InfluxDB queries.
|
||||
|
||||
## Annotations
|
||||
Annotations allows you to overlay rich event information on top of graphs.
|
||||
|
||||
[Annotations]({{< relref "reference/annotations.md" >}}) allows you to overlay rich event information on top of graphs. You add annotation
|
||||
queries via the Dashboard menu / Annotations view.
|
||||
|
||||
An example query:
|
||||
|
||||
@@ -129,4 +173,8 @@ An example query:
|
||||
SELECT title, description from events WHERE $timeFilter order asc
|
||||
```
|
||||
|
||||
For InfluxDB you need to enter a query like in the above example. You need to have the ```where $timeFilter```
|
||||
part. If you only select one column you will not need to enter anything in the column mapping fields. The
|
||||
Tags field can be a comma seperated string.
|
||||
|
||||
|
||||
|
||||
@@ -0,0 +1,118 @@
|
||||
+++
|
||||
title = "Using MySQL in Grafana"
|
||||
description = "Guide for using MySQL in Grafana"
|
||||
keywords = ["grafana", "mysql", "guide"]
|
||||
type = "docs"
|
||||
[menu.docs]
|
||||
name = "MySQL"
|
||||
parent = "datasources"
|
||||
weight = 7
|
||||
+++
|
||||
|
||||
# Using MySQL in Grafana
|
||||
|
||||
> Only available in Grafana v4.3+. This data source is not ready for
|
||||
> production use, currently in development (alpha state).
|
||||
|
||||
Grafana ships with a built-in MySQL data source plugin that allow you to query any visualize
|
||||
data from a MySQL compatible database.
|
||||
|
||||
## Adding the data source
|
||||
|
||||
1. Open the side menu by clicking the Grafana icon in the top header.
|
||||
2. In the side menu under the `Dashboards` link you should find a link named `Data Sources`.
|
||||
3. Click the `+ Add data source` button in the top header.
|
||||
4. Select *MySQL* from the *Type* dropdown.
|
||||
|
||||
### Database User Permissions (Important!)
|
||||
|
||||
The database user you specify when you add the data source should only be granted SELECT permissions on
|
||||
the specified database & tables you want to query. Grafana does not validate that the query is safe. The query
|
||||
could include any SQL statement. For example, statements like `USE otherdb;` and `DROP TABLE user;` would be
|
||||
executed. To protect against this we **Highly** recommmend you create a specific mysql user with
|
||||
restricted permissions.
|
||||
|
||||
Example:
|
||||
|
||||
```sql
|
||||
CREATE USER 'grafanaReader' IDENTIFIED BY 'password';
|
||||
GRANT SELECT ON mydatabase.mytable TO 'grafanaReader';
|
||||
```
|
||||
|
||||
You can use wildcards (`*`) in place of database or table if you want to grant access to more databases and tables.
|
||||
|
||||
## Macros
|
||||
|
||||
To simplify syntax and to allow for dynamic parts, like date range filters, the query can contain macros.
|
||||
|
||||
Macro example | Description
|
||||
------------ | -------------
|
||||
*$__timeFilter(dateColumn)* | Will be replaced by a time range filter using the specified column name. For example, *dateColumn > FROM_UNIXTIME(1494410783) AND dateColumn < FROM_UNIXTIME(1494497183)*
|
||||
|
||||
We plan to add many more macros. If you have suggestions for what macros you would like to see, please
|
||||
[open an issue](https://github.com/grafana/grafana) in our GitHub repo.
|
||||
|
||||
The query editor has a link named `Generated SQL` that show up after a query as been executed, while in panel edit mode. Click
|
||||
on it and it will expand and show the raw interpolated SQL string that was executed.
|
||||
|
||||
## Table queries
|
||||
|
||||
If the `Format as` query option is set to `Table` then you can basically do any type of SQL query. The table panel will automatically show the results of whatever columns & rows your query returns.
|
||||
|
||||
Query editor with example query:
|
||||
|
||||

|
||||
|
||||
|
||||
The query:
|
||||
|
||||
```sql
|
||||
SELECT
|
||||
title as 'Title',
|
||||
user.login as 'Created By' ,
|
||||
dashboard.created as 'Created On'
|
||||
FROM dashboard
|
||||
INNER JOIN user on user.id = dashboard.created_by
|
||||
WHERE $__timeFilter(dashboard.created)
|
||||
```
|
||||
|
||||
You can control the name of the Table panel columns by using regular `as ` SQL column selection syntax.
|
||||
|
||||
The resulting table panel:
|
||||
|
||||

|
||||
|
||||
### Time series queries
|
||||
|
||||
If you set `Format as` to `Time series`, for use in Graph panel for example, then there are some requirements for
|
||||
what your query returns.
|
||||
|
||||
- Must be a column named `time_sec` representing a unix epoch in seconds.
|
||||
- Must be a column named `value` representing the time series value.
|
||||
- Must be a column named `metric` representing the time series name.
|
||||
|
||||
Example:
|
||||
|
||||
```sql
|
||||
SELECT
|
||||
min(UNIX_TIMESTAMP(time_date_time)) as time_sec,
|
||||
max(value_double) as value,
|
||||
metric1 as metric
|
||||
FROM test_data
|
||||
WHERE $__timeFilter(time_date_time)
|
||||
GROUP BY metric1, UNIX_TIMESTAMP(time_date_time) DIV 300
|
||||
ORDER BY time_sec asc
|
||||
```
|
||||
|
||||
Currently, there is no support for a dynamic group by time based on time range & panel width.
|
||||
This is something we plan to add.
|
||||
|
||||
## Templating
|
||||
|
||||
You can use variables in your queries but there are currently no support for defining `Query` variables
|
||||
that target a MySQL data source.
|
||||
|
||||
## Alerting
|
||||
|
||||
Time series queries should work in alerting conditions. Table formatted queries is not yet supported in alert rule
|
||||
conditions.
|
||||
@@ -3,7 +3,7 @@ title = "Using OpenTSDB in Grafana"
|
||||
description = "Guide for using OpenTSDB in Grafana"
|
||||
keywords = ["grafana", "opentsdb", "guide"]
|
||||
type = "docs"
|
||||
aliases = ["/datasources/opentsdb"]
|
||||
aliases = ["/datasources/opentsdb", "docs/features/opentsdb"]
|
||||
[menu.docs]
|
||||
name = "OpenTSDB"
|
||||
parent = "datasources"
|
||||
@@ -12,59 +12,79 @@ weight = 5
|
||||
|
||||
# Using OpenTSDB in Grafana
|
||||
|
||||
{{< docs-imagebox img="/img/docs/v2/add_OpenTSDB.png" max-width="14rem" >}}
|
||||
Grafana ships with advanced support for OpenTSDB.
|
||||
|
||||
The newest release of Grafana adds additional functionality when using an OpenTSDB Data source.
|
||||
## Adding the data source
|
||||
|
||||
1. Open the side menu by clicking the the Grafana icon in the top header.
|
||||
1. Open the side menu by clicking the Grafana icon in the top header.
|
||||
2. In the side menu under the `Dashboards` link you should find a link named `Data Sources`.
|
||||
3. Click the `+ Add data source` button in the top header.
|
||||
4. Select *OpenTSDB* from the *Type* dropdown.
|
||||
|
||||
> NOTE: If this link is missing in the side menu it means that your current user does not have the `Admin` role for the current organization.
|
||||
|
||||
3. Click the `Add new` link in the top header.
|
||||
4. Select `OpenTSDB` from the dropdown.
|
||||
> NOTE: If you're not seeing the `Data Sources` link in your side menu it means that your current user does not have the `Admin` role for the current organization.
|
||||
|
||||
Name | Description
|
||||
------------ | -------------
|
||||
Name | The data source name, important that this is the same as in Grafana v1.x if you plan to import old dashboards.
|
||||
Default | Default data source means that it will be pre-selected for new panels.
|
||||
Url | The http protocol, ip and port of you opentsdb server (default port is usually 4242)
|
||||
Access | Proxy = access via Grafana backend, Direct = access directly from browser.
|
||||
Version | Version = opentsdb version, either <=2.1 or 2.2
|
||||
Resolution | Metrics from opentsdb may have datapoints with either second or millisecond resolution.
|
||||
*Name* | The data source name. This is how you refer to the data source in panels & queries.
|
||||
*Default* | Default data source means that it will be pre-selected for new panels.
|
||||
*Url* | The http protocol, ip and port of you opentsdb server (default port is usually 4242)
|
||||
*Access* | Proxy = access via Grafana backend, Direct = access directly from browser.
|
||||
*Version* | Version = opentsdb version, either <=2.1 or 2.2
|
||||
*Resolution* | Metrics from opentsdb may have datapoints with either second or millisecond resolution.
|
||||
|
||||
|
||||
## Query editor
|
||||
Open a graph in edit mode by click the title. Query editor will differ if the datasource has version <=2.1 or = 2.2. In the former version, only tags can be used to query opentsdb. But in the latter version, filters as well as tags can be used to query opentsdb. Fill Policy is also introduced in opentsdb 2.2.
|
||||
|
||||
> Note: While using Opentsdb 2.2 datasource, make sure you use either Filters or Tags as they are mutually exclusive. If used together, might give you weird results.
|
||||
Open a graph in edit mode by click the title. Query editor will differ if the datasource has version <=2.1 or = 2.2.
|
||||
In the former version, only tags can be used to query OpenTSDB. But in the latter version, filters as well as tags
|
||||
can be used to query opentsdb. Fill Policy is also introduced in OpenTSDB 2.2.
|
||||
|
||||

|
||||

|
||||
|
||||
> Note: While using OpenTSDB 2.2 datasource, make sure you use either Filters or Tags as they are mutually exclusive. If used together, might give you weird results.
|
||||
|
||||
### Auto complete suggestions
|
||||
As soon as you start typing metric names, tag names and tag values , you should see highlighted auto complete suggestions for them.
|
||||
|
||||
> Note: This is required for the OpenTSDB `suggest` api to work.
|
||||
As soon as you start typing metric names, tag names and tag values , you should see highlighted auto complete suggestions for them.
|
||||
The autocomplete only works if the OpenTSDB suggest api is enabled.
|
||||
|
||||
## Templating queries
|
||||
Grafana's OpenTSDB data source now supports template variable values queries. This means you can create template variables that fetch the values from OpenTSDB (for example metric names, tag names, or tag values). The query editor is also enhanced to limiting tags by metric.
|
||||
|
||||
Instead of hard-coding things like server, application and sensor name in you metric queries you can use variables in their place.
|
||||
Variables are shown as dropdown select boxes at the top of the dashboard. These dropdowns makes it easy to change the data
|
||||
being displayed in your dashboard.
|
||||
|
||||
Checkout the [Templating]({{< relref "reference/templating.md" >}}) documentation for an introduction to the templating feature and the different
|
||||
types of template variables.
|
||||
|
||||
### Query variable
|
||||
|
||||
Grafana's OpenTSDB data source supports template variable queries. This means you can create template variables
|
||||
that fetch the values from OpenTSDB. For example, metric names, tag names, or tag values.
|
||||
|
||||
When using OpenTSDB with a template variable of `query` type you can use following syntax for lookup.
|
||||
|
||||
metrics(prefix) // returns metric names with specific prefix (can be empty)
|
||||
tag_names(cpu) // return tag names (i.e. keys) for a specific cpu metric
|
||||
tag_values(cpu, hostname) // return tag values for metric cpu and tag key hostname
|
||||
suggest_tagk(prefix) // return tag names (i.e. keys) for all metrics with specific prefix (can be empty)
|
||||
suggest_tagv(prefix) // return tag values for all metrics with specific prefix (can be empty)
|
||||
Query | Description
|
||||
------------ | -------------
|
||||
*metrics(prefix)* | Returns metric names with specific prefix (can be empty)
|
||||
*tag_names(cpu)* | Return tag names (i.e. keys) for a specific cpu metric
|
||||
*tag_values(cpu, hostname)* | Return tag values for metric cpu and tag key hostname
|
||||
*suggest_tagk(prefix)* | Return tag names (i.e. keys) for all metrics with specific prefix (can be empty)
|
||||
*suggest_tagv(prefix)* | Return tag values for all metrics with specific prefix (can be empty)
|
||||
|
||||
If you do not see template variables being populated in `Preview of values` section, you need to enable `tsd.core.meta.enable_realtime_ts` in the OpenTSDB server settings. Also, to populate metadata of the existing time series data in OpenTSDB, you need to run `tsdb uid metasync` on the OpenTSDB server.
|
||||
If you do not see template variables being populated in `Preview of values` section, you need to enable
|
||||
`tsd.core.meta.enable_realtime_ts` in the OpenTSDB server settings. Also, to populate metadata of
|
||||
the existing time series data in OpenTSDB, you need to run `tsdb uid metasync` on the OpenTSDB server.
|
||||
|
||||
### Nested Templating
|
||||
|
||||
One template variable can be used to filter tag values for another template varible. Very importantly, the order of the parameters matter in tag_values function. First parameter is the metric name, second parameter is the tag key for which you need to find tag values, and after that all other dependent template variables. Some examples are mentioned below to make nested template queries work successfully.
|
||||
One template variable can be used to filter tag values for another template varible. First parameter is the metric name,
|
||||
second parameter is the tag key for which you need to find tag values, and after that all other dependent template variables.
|
||||
Some examples are mentioned below to make nested template queries work successfully.
|
||||
|
||||
tag_values(cpu, hostname, env=$env) // return tag values for cpu metric, selected env tag value and tag key hostname
|
||||
tag_values(cpu, hostanme, env=$env, region=$region) // return tag values for cpu metric, selected env tag value, selected region tag value and tag key hostname
|
||||
Query | Description
|
||||
------------ | -------------
|
||||
*tag_values(cpu, hostname, env=$env)* | Return tag values for cpu metric, selected env tag value and tag key hostname
|
||||
*tag_values(cpu, hostanme, env=$env, region=$region)* | Return tag values for cpu metric, selected env tag value, selected region tag value and tag key hostname
|
||||
|
||||
> Note: This is required for the OpenTSDB `lookup` api to work.
|
||||
|
||||
For details on opentsdb metric queries checkout the official [OpenTSDB documentation](http://opentsdb.net/docs/build/html/index.html)
|
||||
For details on OpenTSDB metric queries checkout the official [OpenTSDB documentation](http://opentsdb.net/docs/build/html/index.html)
|
||||
|
||||
@@ -10,74 +10,86 @@ parent = "datasources"
|
||||
weight = 2
|
||||
+++
|
||||
|
||||
|
||||
# Using Prometheus in Grafana
|
||||
|
||||
Grafana includes support for Prometheus Datasources. While the process of adding the datasource is similar to adding a Graphite or OpenTSDB datasource type, Prometheus does have a few different options for building queries.
|
||||
Grafana includes built-in support for Prometheus.
|
||||
|
||||
## Adding the data source to Grafana
|
||||
|
||||

|
||||
|
||||
1. Open the side menu by clicking the the Grafana icon in the top header.
|
||||
1. Open the side menu by clicking the Grafana icon in the top header.
|
||||
2. In the side menu under the `Dashboards` link you should find a link named `Data Sources`.
|
||||
3. Click the `+ Add data source` button in the top header.
|
||||
4. Select `Prometheus` from the *Type* dropdown.
|
||||
|
||||
> NOTE: If this link is missing in the side menu it means that your current user does not have the `Admin` role for the current organization.
|
||||
> NOTE: If you're not seeing the `Data Sources` link in your side menu it means that your current user does not have the `Admin` role for the current organization.
|
||||
|
||||
3. Click the `Add new` link in the top header.
|
||||
4. Select `Prometheus` from the dropdown.
|
||||
## Data source options
|
||||
|
||||
Name | Description
|
||||
------------ | -------------
|
||||
Name | The data source name, important that this is the same as in Grafana v1.x if you plan to import old dashboards.
|
||||
Default | Default data source means that it will be pre-selected for new panels.
|
||||
Url | The http protocol, ip and port of you Prometheus server (default port is usually 9090)
|
||||
Access | Proxy = access via Grafana backend, Direct = access directly from browser.
|
||||
Basic Auth | Enable basic authentication to the Prometheus datasource.
|
||||
User | Name of your Prometheus user
|
||||
Password | Database user's password
|
||||
|
||||
> Proxy access means that the Grafana backend will proxy all requests from the browser, and send them on to the Data Source. This is useful because it can eliminate CORS (Cross Origin Site Resource) issues, as well as eliminate the need to disseminate authentication details to the Data Source to the browser.
|
||||
|
||||
> Direct access is still supported because in some cases it may be useful to access a Data Source directly depending on the use case and topology of Grafana, the user, and the Data Source.
|
||||
*Name* | The data source name. This is how you refer to the data source in panels & queries.
|
||||
*Default* | Default data source means that it will be pre-selected for new panels.
|
||||
*Url* | The http protocol, ip and port of you Prometheus server (default port is usually 9090)
|
||||
*Access* | Proxy = access via Grafana backend, Direct = access directly from browser.
|
||||
*Basic Auth* | Enable basic authentication to the Prometheus data source.
|
||||
*User* | Name of your Prometheus user
|
||||
*Password* | Database user's password
|
||||
|
||||
## Query editor
|
||||
Open a graph in edit mode by click the title.
|
||||
|
||||

|
||||
Open a graph in edit mode by click the title > Edit (or by pressing `e` key while hovering over panel).
|
||||
|
||||
For details on Prometheus metric queries check out the Prometheus documentation
|
||||
- [Query Metrics - Prometheus documentation](http://prometheus.io/docs/querying/basics/).
|
||||
|
||||
## Templated queries
|
||||
|
||||
Prometheus Datasource Plugin provides the following functions in `Variables values query` field in Templating Editor to query `metric names` and `labels names` on the Prometheus server.
|
||||

|
||||
|
||||
Name | Description
|
||||
------- | --------
|
||||
`label_values(label)` | Returns a list of label values for the `label` in every metric.
|
||||
`label_values(metric, label)` | Returns a list of label values for the `label` in the specified metric.
|
||||
`metrics(metric)` | Returns a list of metrics matching the specified `metric` regex.
|
||||
`query_result(query)` | Returns a list of Prometheus query result for the `query`.
|
||||
*Query expression* | Prometheus query expression, check out the [Prometheus documentation](http://prometheus.io/docs/querying/basics/).
|
||||
*Legend format* | Controls the name of the time series, using name or pattern. For example `{{hostname}}` will be replaced with label value for the label `hostname`.
|
||||
*Min step* | Set a lower limit for the Prometheus step option. Step controls how big the jumps are when the Prometheus query engine performs range queries. Sadly there is no official prometheus documentation to link to for this very important option.
|
||||
*Resolution* | Controls the step option. Small steps create high-resolution graphs but can be slow over larger time ranges, lowering the resolution can speed things up. `1/2` will try to set step option to generate 1 data point for every other pixel. A value of `1/10` will try to set step option so there is a data point every 10 pixels.*Metric lookup* | Search for metric names in this input field.
|
||||
*Format as* | **(New in v4.3)** Switch between Table & Time series. Table format will only work in the Table panel.
|
||||
|
||||
For details of `metric names` & `label names`, and `label values`, please refer to the [Prometheus documentation](http://prometheus.io/docs/concepts/data_model/#metric-names-and-labels).
|
||||
## Templating
|
||||
|
||||
> Note: The part of queries is incompatible with the version before 2.6, if you specify like `foo.*`, please change like `metrics(foo.*)`.
|
||||
Instead of hard-coding things like server, application and sensor name in you metric queries you can use variables in their place.
|
||||
Variables are shown as dropdown select boxes at the top of the dashboard. These dropdowns makes it easy to change the data
|
||||
being displayed in your dashboard.
|
||||
|
||||
You can create a template variable in Grafana and have that variable filled with values from any Prometheus metric exploration query.
|
||||
You can then use this variable in your Prometheus metric queries.
|
||||
Checkout the [Templating]({{< relref "reference/templating.md" >}}) documentation for an introduction to the templating feature and the different
|
||||
types of template variables.
|
||||
|
||||
For example you can have a variable that contains all values for label `hostname` if you specify a query like this in the templating edit view.
|
||||
### Query variable
|
||||
|
||||
```sql
|
||||
label_values(hostname)
|
||||
```
|
||||
Variable of the type *Query* allows you to query Prometheus for a list of metrics, labels or label values. The Prometheus data source plugin
|
||||
provides the following functions you can use in the `Query` input field.
|
||||
|
||||
You can also use raw queries & regular expressions to extract anything you might need.
|
||||
Name | Description
|
||||
---- | --------
|
||||
*label_values(label)* | Returns a list of label values for the `label` in every metric.
|
||||
*label_values(metric, label)* | Returns a list of label values for the `label` in the specified metric.
|
||||
*metrics(metric)* | Returns a list of metrics matching the specified `metric` regex.
|
||||
*query_result(query)* | Returns a list of Prometheus query result for the `query`.
|
||||
|
||||
### Using templated variables in queries
|
||||
For details of *metric names*, *label names* and *label values* are please refer to the [Prometheus documentation](http://prometheus.io/docs/concepts/data_model/#metric-names-and-labels).
|
||||
|
||||
When the `Include All` option or `Multi-Value` option is enabled, Grafana converts the labels from plain text to a regex compatible string.
|
||||
Which means you have to use `=~` instead of `=` in your Prometheus queries. For example `ALERTS{instance=~$instance}` instead of `ALERTS{instance=$instance}`.
|
||||
### Using variables in queries
|
||||
|
||||

|
||||
There are two syntaxes:
|
||||
|
||||
- `$<varname>` Example: rate(http_requests_total{job=~"$job"}[5m])
|
||||
- `[[varname]]` Example: rate(http_requests_total{job="my[[job]]"}[5m])
|
||||
|
||||
Why two ways? The first syntax is easier to read and write but does not allow you to use a variable in the middle of a word. When the *Multi-value* or *Include all value*
|
||||
options are enabled, Grafana converts the labels from plain text to a regex compatible string. Which means you have to use `=~` instead of `=`.
|
||||
|
||||
## Annotations
|
||||
|
||||
[Annotations]({{< relref "reference/annotations.md" >}}) allows you to overlay rich event information on top of graphs. You add annotation
|
||||
queries via the Dashboard menu / Annotations view.
|
||||
|
||||
Prometheus supports two ways to query annotations.
|
||||
|
||||
- A regular metric query
|
||||
- A Prometheus query for pending and firing alerts (for details see [Inspecting alerts during runtime](https://prometheus.io/docs/alerting/rules/#inspecting-alerts-during-runtime))
|
||||
|
||||
The step option is useful to limit the number of events returned from your query.
|
||||
|
||||
@@ -11,26 +11,20 @@ weight = 20
|
||||
|
||||
# Grafana TestData
|
||||
|
||||
> NOTE: This plugin is disable by default.
|
||||
|
||||
The purpose of this data sources is to make it easier to create fake data for any panel.
|
||||
Using `Grafana TestData` you can build your own time series and have any panel render it.
|
||||
This make is much easier to verify functionally since the data can be shared very
|
||||
|
||||
## Enable
|
||||
|
||||
`Grafana TestData` is not enabled by default. To enable it you have to go to `/plugins/testdata/edit` and click the enable button to enable it for each server.
|
||||
`Grafana TestData` is not enabled by default. To enable it you have to go to `/plugins/testdata/edit` and click the enable button to enable.
|
||||
|
||||
## Create mock data.
|
||||
|
||||
Once `Grafana TestData` is enabled you use it as a datasource in the metric panel.
|
||||
Once `Grafana TestData` is enabled you can use it as a data source in any metric panel.
|
||||
|
||||

|
||||
|
||||
## Scenarios
|
||||
|
||||
You can now choose different scenario that you want rendered in the drop down menu. If you have scenarios that you think should be added, please add them to `` and submit a pull request.
|
||||
|
||||
## CSV
|
||||
|
||||
The comma separated values scenario is the most powerful one since it lets you create any kind of graph you like.
|
||||
@@ -38,7 +32,6 @@ Once you provided the numbers `Grafana TestData` will distribute them evenly bas
|
||||
|
||||

|
||||
|
||||
|
||||
## Dashboards
|
||||
|
||||
`Grafana TestData` also contains some dashboards with example. `/plugins/testdata/edit`
|
||||
|
||||
@@ -2,6 +2,7 @@
|
||||
title = "Dashboard List"
|
||||
keywords = ["grafana", "dashboard list", "documentation", "panel", "dashlist"]
|
||||
type = "docs"
|
||||
aliases = ["/reference/dashlist/"]
|
||||
[menu.docs]
|
||||
name = "Dashboard list"
|
||||
parent = "panels"
|
||||
|
||||
@@ -2,6 +2,7 @@
|
||||
title = "Graph Panel"
|
||||
keywords = ["grafana", "graph panel", "documentation", "guide", "graph"]
|
||||
type = "docs"
|
||||
aliases = ["/reference/graph/"]
|
||||
[menu.docs]
|
||||
name = "Graph"
|
||||
parent = "panels"
|
||||
@@ -18,7 +19,8 @@ Clicking the title for a panel exposes a menu. The `edit` option opens addition
|
||||
options for the panel.
|
||||
|
||||
## General
|
||||

|
||||
|
||||

|
||||
|
||||
The general tab allows customization of a panel's appearance and menu options.
|
||||
|
||||
@@ -31,14 +33,14 @@ The general tab allows customization of a panel's appearance and menu options.
|
||||
### Drilldown / detail link
|
||||
|
||||
The drilldown section allows adding dynamic links to the panel that can link to other dashboards
|
||||
or URLs
|
||||
or URLs.
|
||||
|
||||
Each link has a title, a type and params. A link can be either a ``dashboard`` or ``absolute`` links.
|
||||
If it is a dashboard links, the `dashboard` value must be the name of a dashboard. If it's an
|
||||
`absolute` link, the URL is the URL to link.
|
||||
If it is a dashboard link, the `dashboard` value must be the name of a dashboard. If it is an
|
||||
`absolute` link, the URL is the URL to the link.
|
||||
|
||||
``params`` allows adding additional URL params to the links. The format is the ``name=value`` with
|
||||
multiple params separate by ``&``. Template variables can be added as values using ``$myvar``.
|
||||
multiple params separated by ``&``. Template variables can be added as values using ``$myvar``.
|
||||
|
||||
When linking to another dashboard that uses template variables, you can use ``var-myvar=value`` to
|
||||
populate the template variable to a desired value from the link.
|
||||
@@ -50,7 +52,7 @@ options.
|
||||
|
||||
## Axes & Grid
|
||||
|
||||

|
||||

|
||||
|
||||
The Axes & Grid tab controls the display of axes, grids and legend.
|
||||
|
||||
@@ -74,7 +76,6 @@ values can be hidden from the legend using the ``Hide empty`` checkbox.
|
||||
### Legend Values
|
||||
|
||||
Additional values can be shown along-side the legend names:
|
||||
|
||||
- ``Total`` - Sum of all values returned from metric query
|
||||
- ``Current`` - Last value returned from the metric query
|
||||
- ``Min`` - Minimum of all values returned from metric query
|
||||
@@ -83,16 +84,16 @@ Additional values can be shown along-side the legend names:
|
||||
- ``Decimals`` - Controls how many decimals are displayed for legend values (and graph hover tooltips)
|
||||
|
||||
The legend values are calculated client side by Grafana and depend on what type of
|
||||
aggregation or point consolidation you metric query is using. All the above legend values cannot
|
||||
aggregation or point consolidation your metric query is using. All the above legend values cannot
|
||||
be correct at the same time. For example if you plot a rate like requests/second, this is probably
|
||||
using average as aggregator, then the Total in the legend will not represent the total number of requests.
|
||||
It is just the sum of all data points received by Grafana.
|
||||
|
||||
## Display styles
|
||||
|
||||

|
||||

|
||||
|
||||
Display styles controls properties of the graph.
|
||||
Display styles control visual properties of the graph.
|
||||
|
||||
### Thresholds
|
||||
|
||||
@@ -108,19 +109,19 @@ the graph crosses a particular threshold.
|
||||
|
||||
### Line Options
|
||||
|
||||
- ``Line Fill`` - Amount of color fill for a series. 0 is none.
|
||||
- ``Line Fill`` - Amount of color fill for a series. 0 is none.
|
||||
- ``Line Width`` - The width of the line for a series.
|
||||
- ``Null point mode`` - How null values are displayed
|
||||
- ``Staircase line`` - Draws adjacent points as staircase
|
||||
|
||||
### Multiple Series
|
||||
|
||||
If there are multiple series, they can be display as a group.
|
||||
If there are multiple series, they can be displayed as a group.
|
||||
|
||||
- ``Stack`` - Each series is stacked on top of another
|
||||
- ``Percent`` - Each series is draw as a percent of the total of all series
|
||||
- ``Percent`` - Each series is drawn as a percentage of the total of all series
|
||||
|
||||
If you have stack enabled you can select what the mouse hover feature should show.
|
||||
If you have stack enabled, you can select what the mouse hover feature should show.
|
||||
|
||||
- Cumulative - Sum of series below plus the series you hover over
|
||||
- Individual - Just the value for the series you hover over
|
||||
@@ -134,11 +135,15 @@ If you have stack enabled you can select what the mouse hover feature should sho
|
||||
|
||||
- ``All series`` - Show all series on the same tooltip and a x crosshairs to help follow all series
|
||||
|
||||
### Series specific overrides
|
||||
### Series Specific Overrides
|
||||
|
||||
The section allows a series to be render different from the rest. For example, one series can be given
|
||||
a thicker line width to make it standout.
|
||||
The section allows a series to be rendered differently from the others. For example, one series can be given
|
||||
a thicker line width to make it stand out.
|
||||
|
||||
## Time range
|
||||
#### Dashes Drawing Style
|
||||
|
||||
There is an option under Series overrides to draw lines as dashes. Set Dashes to the value True to override the line draw setting for a specific series.
|
||||
|
||||
## Time Range
|
||||
|
||||

|
||||
|
||||
@@ -0,0 +1,108 @@
|
||||
+++
|
||||
title = "Heatmap Panel"
|
||||
description = "Heatmap panel documentation"
|
||||
keywords = ["grafana", "heatmap", "panel", "documentation"]
|
||||
type = "docs"
|
||||
[menu.docs]
|
||||
name = "Heatmap"
|
||||
parent = "panels"
|
||||
weight = 3
|
||||
+++
|
||||
|
||||
# Heatmap Panel
|
||||
|
||||
> New panel only available in Grafana v4.3+
|
||||
|
||||

|
||||
|
||||
The Heatmap panel allows you to view histograms over time. To fully understand and use this panel you need
|
||||
understand what Histograms are and how they are created. Read on below to for a quick introduction to the
|
||||
term Histogram.
|
||||
|
||||
## Histograms and buckets
|
||||
|
||||
A histogram is a graphical representation of the distribution of numerical data. You group values into buckets
|
||||
(some times also called bins) and then count how many values fall into each bucket. Instead
|
||||
of graphing the actual values you then graph the buckets. Each bar represents a bucket
|
||||
and the bar height represents the frequency (i.e. count) of values that fell into that bucket's interval.
|
||||
|
||||
Example Histogram:
|
||||
|
||||

|
||||
|
||||
The above histogram shows us that most value distribution of a couple of time series. We can easily see that
|
||||
most values land between 240-300 with a peak between 260-280. Histograms just look at value distributions
|
||||
over specific time range. So you cannot see any trend or changes in the distribution over time,
|
||||
this is where heatmaps become useful.
|
||||
|
||||
## Heatmap
|
||||
|
||||
A Heatmap is like a histogram but over time where each time slice represents its own
|
||||
histogram. Instead of using bar height as a representation of frequency you use cells and color
|
||||
the cell proportional to the number of values in the bucket.
|
||||
|
||||
Example:
|
||||
|
||||

|
||||
|
||||
Here we can clearly see what values are more common and how they trend over time.
|
||||
|
||||
## Data Options
|
||||
|
||||
Data and bucket options can be found in the `Axes` tab.
|
||||
|
||||
### Data Formats
|
||||
|
||||
Data format | Description
|
||||
------------ | -------------
|
||||
*Time series* | Grafana does the bucketing by going through all time series values. The bucket sizes & intervals will be determined using the Buckets options.
|
||||
*Time series buckets* | Each time series already represents a Y-Axis bucket. The time series name (alias) needs to be a numeric value representing the upper interval for the bucket. Grafana does no bucketing so the bucket size options are hidden.
|
||||
|
||||
### Bucket Size
|
||||
|
||||
The Bucket count & size options are used by Grafana to calculate how big each cell in the heatmap is. You can
|
||||
define the bucket size either by count (the first input box) or by specifying a size interval. For the Y-Axis
|
||||
the size interval is just a value but for the X-bucket you can specify a time range in the *Size* input, for example,
|
||||
the time range `1h`. This will make the cells 1h wide on the X-axis.
|
||||
|
||||
### Pre-bucketed data
|
||||
|
||||
If you have a data that is already organized into buckets you can use the `Time series buckets` data format. This format requires that your metric query return regular time series and that each time series has a numeric name
|
||||
that represent the upper or lower bound of the interval.
|
||||
|
||||
The only data source that supports histograms over time is Elasticsearch. You do this by adding a *Histogram*
|
||||
bucket aggregation before the *Date Histogram*.
|
||||
|
||||

|
||||
|
||||
You control the size of the buckets using the Histogram interval (Y-Axis) and the Date Histogram interval (X-axis).
|
||||
|
||||
## Display Options
|
||||
|
||||
In the heatmap *Display* tab you define how the cells are rendered and what color they are assigned.
|
||||
|
||||
### Color Mode & Spectrum
|
||||
|
||||
{{< imgbox max-width="40%" img="/img/docs/v43/heatmap_scheme.png" caption="Color spectrum" >}}
|
||||
|
||||
The color spectrum controls the mapping between value count (in each bucket) and the color assigned to each bucket.
|
||||
The left most color on the spectrum represents the minimum count and the color on the right most side represents the
|
||||
maximum count. Some color schemes are automatically inverted when using the light theme.
|
||||
|
||||
You can also change the color mode to `Opacity`. In this case, the color will not change but the amount of opacity will
|
||||
change with the bucket count.
|
||||
|
||||
## Raw data vs aggregated
|
||||
|
||||
If you use the heatmap with regular time series data (not pre-bucketed). Then it's important to keep in mind that your data
|
||||
is often already by aggregated by your time series backend. Most time series queries do not return raw sample data
|
||||
but include a group by time interval or maxDataPoints limit coupled with an aggregation function (usually average).
|
||||
|
||||
This all depends on the time range of your query of course. But the important point is to know that the Histogram bucketing
|
||||
that Grafana performs may be done on already aggregated and averaged data. To get more accurate heatmaps it is better
|
||||
to do the bucketing during metric collection or store the data in Elasticsearch, which currently is the only data source
|
||||
data supports doing Histogram bucketing on the raw data.
|
||||
|
||||
If you remove or lower the group by time (or raise maxDataPoints) in your query to return more data points your heatmap will be
|
||||
more accurate but this can also be very CPU & Memory taxing for your browser and could cause hangs and crashes if the number of
|
||||
data points becomes unreasonably large.
|
||||
@@ -2,6 +2,7 @@
|
||||
title = "Singlestat Panel"
|
||||
keywords = ["grafana", "dashboard", "documentation", "panels", "singlestat"]
|
||||
type = "docs"
|
||||
aliases = ["/reference/singlestat/"]
|
||||
[menu.docs]
|
||||
name = "Singlestat"
|
||||
parent = "panels"
|
||||
|
||||
@@ -2,6 +2,7 @@
|
||||
title = "Table Panel"
|
||||
keywords = ["grafana", "dashboard", "documentation", "panels", "table panel"]
|
||||
type = "docs"
|
||||
aliases = ["/reference/table/"]
|
||||
[menu.docs]
|
||||
name = "Table"
|
||||
parent = "panels"
|
||||
@@ -84,8 +85,9 @@ The column styles allow you control how dates and numbers are formatted.
|
||||
|
||||
1. `Name or regex`: The Name or Regex field controls what columns the rule should be applied to. The regex or name filter will be matched against the column name not against column values.
|
||||
2. `Type`: The three supported types of types are `Number`, `String` and `Date`.
|
||||
3. `Format`: Specify date format. Only available when `Type` is set to `Date`.
|
||||
4. `Coloring` and `Thresholds`: Specify color mode and thresholds limits.
|
||||
5. `Unit` and `Decimals`: Specify unit and decimal precision for numbers.
|
||||
6. `Add column style rule`: Add new column rule.
|
||||
3. `Title`: Title for the column, when using a Regex the title can include replacement strings like `$1`.
|
||||
4. `Format`: Specify date format. Only available when `Type` is set to `Date`.
|
||||
5. `Coloring` and `Thresholds`: Specify color mode and thresholds limits.
|
||||
6. `Unit` and `Decimals`: Specify unit and decimal precision for numbers.
|
||||
7. `Add column style rule`: Add new column rule.
|
||||
|
||||
|
||||
@@ -3,6 +3,7 @@ title = "Getting Started"
|
||||
description = "Getting started with Grafana guide"
|
||||
keywords = ["grafana", "intro", "guide", "started"]
|
||||
type = "docs"
|
||||
aliases = ["/guides/gettingstarted"]
|
||||
[menu.docs]
|
||||
name = "Getting Started"
|
||||
identifier = "getting_started_guide"
|
||||
|
||||
@@ -26,7 +26,7 @@ select data source and optional metrix prefix options.
|
||||
<img src="/img/docs/v31/import_step1.png">
|
||||
|
||||
The above screenshot shows the new import modal that gives you 3 options for how to import a dashboard.
|
||||
One notable new addition here is the ability to import directly from Dashboards shared on [Grafana.net](https://grafana.net).
|
||||
One notable new addition here is the ability to import directly from Dashboards shared on [Grafana.com](https://grafana.com).
|
||||
|
||||
The next step in the import process:
|
||||
|
||||
@@ -37,9 +37,9 @@ shows a CollectD dashboard for Graphite that requires a metric prefix be specifi
|
||||
|
||||
## Discover Dashboards
|
||||
|
||||
On [Grafana.net](https://grafana.net) you can now browse & search for dashboards. We have already added a few but
|
||||
On [Grafana.com](https://grafana.com) you can now browse & search for dashboards. We have already added a few but
|
||||
more are being uploaded every day. To import a dashboard just copy the dashboard url and head back to Grafana,
|
||||
then Dashboard Search -> Import -> Paste Grafana.net Dashboard URL.
|
||||
then Dashboard Search -> Import -> Paste Grafana.com Dashboard URL.
|
||||
|
||||
<img src="/img/docs/v31/gnet_dashboards_list.png">
|
||||
|
||||
|
||||
@@ -14,7 +14,7 @@ weight = 6
|
||||
|
||||
## Commercial Support
|
||||
|
||||
Commercial Support subscriptions for Grafana are now [generally available](https://grafana.net/support/plans/).
|
||||
Commercial Support subscriptions for Grafana are now [generally available](https://grafana.com/support/plans/).
|
||||
|
||||
Raintank is committed to a 100% open-source strategy for Grafana. We
|
||||
do not want to go down the “open core” route. If your organization
|
||||
@@ -41,15 +41,15 @@ two new plugin types:
|
||||
Dashboards, and Grafana **Pages**. Apps are a great way to provide an
|
||||
entire experience right within Grafana.
|
||||
|
||||
## Grafana.net
|
||||
## Grafana.com
|
||||
|
||||
<img src="/img/docs/v3/grafana_net_tour.png">
|
||||
|
||||
[Grafana.net](https://grafana.net) offers a central repository where the community can come together to discover, create and
|
||||
[Grafana.com](https://grafana.com) offers a central repository where the community can come together to discover, create and
|
||||
share plugins (data sources, panels, apps) and dashboards.
|
||||
|
||||
We are also working on a hosted Graphite-compatible data source that will be optimized for use with Grafana.
|
||||
It’ll be easy to combine your existing data source(s) with this OpenSaaS option. Finally, Grafana.net can
|
||||
It’ll be easy to combine your existing data source(s) with this OpenSaaS option. Finally, Grafana.com can
|
||||
also be a hub to manage all your Grafana instances. You’ll be able to monitor their health and availability,
|
||||
perform dashboard backups, and more.
|
||||
|
||||
@@ -57,12 +57,12 @@ We are also working on a hosted Graphite-compatible Data Source that
|
||||
will be optimized for use with Grafana. It’ll be easy to combine your
|
||||
existing Data Source(s) with this OpenSaaS option.
|
||||
|
||||
Finally, Grafana.net will also be a hub to manage all your Grafana
|
||||
Finally, Grafana.com will also be a hub to manage all your Grafana
|
||||
instances. You’ll be able to monitor their health and availability,
|
||||
perform Dashboard backups, and more.
|
||||
|
||||
Grafana.net will officially launch along with the stable version of
|
||||
Grafana 3.0, but <a href=http://www.grafana.net>check out the preview
|
||||
Grafana 3.0, but go to <a href=https://grafana.com> and check out the preview
|
||||
and sign up for an account</a> in the meantime.
|
||||
|
||||
|
||||
@@ -189,37 +189,37 @@ variable is interpolated.
|
||||
data source (or panel) they need to be updated as well.
|
||||
|
||||
* InfluxDB 0.8: This data source is no longer included in releases,
|
||||
you can still install manually from [Grafana.net](http://grafana.net)
|
||||
you can still install manually from [Grafana.com](https://grafana.com)
|
||||
|
||||
* KairosDB: This data source has also no longer shipped with Grafana,
|
||||
you can install it manually from [Grafana.net](http://grafana.net)
|
||||
you can install it manually from [Grafana.com](https://grafana.com)
|
||||
|
||||
## Plugin showcase
|
||||
|
||||
Discovering and installing plugins is very quick and easy with Grafana 3.0 and [Grafana.net](https://grafana.net). Here
|
||||
Discovering and installing plugins is very quick and easy with Grafana 3.0 and [Grafana.com](https://grafana.com). Here
|
||||
are a couple that I incurage you try!
|
||||
|
||||
#### [Clock Panel](https://grafana.net/plugins/grafana-clock-panel)
|
||||
#### [Clock Panel](https://grafana.com/plugins/grafana-clock-panel)
|
||||
Support's both current time and count down mode.
|
||||
<img src="/img/docs/v3/clock_panel.png">
|
||||
|
||||
#### [Pie Chart Panel](https://grafana.net/plugins/grafana-piechart-panel)
|
||||
#### [Pie Chart Panel](https://grafana.com/plugins/grafana-piechart-panel)
|
||||
A simple pie chart panel is now available as an external plugin.
|
||||
<img src="/img/docs/v3/pie_chart_panel.png">
|
||||
|
||||
#### [WorldPing App](https://grafana.net/plugins/raintank-worldping-app)
|
||||
#### [WorldPing App](https://grafana.com/plugins/raintank-worldping-app)
|
||||
This is full blown Grafana App that adds new panels, data sources and pages to give
|
||||
feature rich global performance monitoring directly from your on-prem Grafana.
|
||||
|
||||
<img src="/img/docs/v3/wP-Screenshot-dash-web.png">
|
||||
|
||||
#### [Zabbix App](https://grafana.net/plugins/alexanderzobnin-zabbix-app)
|
||||
#### [Zabbix App](https://grafana.com/plugins/alexanderzobnin-zabbix-app)
|
||||
This app contains the already very pouplar Zabbix data source plugin, 2 dashboards and a triggers panel. It is
|
||||
created and maintained by [Alexander Zobnin](https://github.com/alexanderzobnin/grafana-zabbix).
|
||||
|
||||
<img src="/img/docs/v3/zabbix_app.png">
|
||||
|
||||
Checkout the full list of plugins on [Grafana.net](https://grafana.net/plugins)
|
||||
Checkout the full list of plugins on [Grafana.com](https://grafana.com/plugins)
|
||||
|
||||
## CHANGELOG
|
||||
|
||||
|
||||
@@ -27,7 +27,7 @@ notifications will be sent out when the rule conditions are met.
|
||||
|
||||
This feature has been worked on for over a year with many iterations and rewrites
|
||||
just to make sure the foundations are really solid. We are really proud to finally release it!
|
||||
Since the alerting execution is processed in the backend all data source plugins are not supported.
|
||||
Since the alerting execution is processed in the backend not all data source plugins are supported.
|
||||
Right now Graphite, Prometheus, InfluxDB and OpenTSDB are supported. Elasticsearch is being worked
|
||||
on but will be not ready for v4 release.
|
||||
|
||||
@@ -70,8 +70,8 @@ to add graph comments in the form of annotations directly from within Grafana in
|
||||
|
||||
{{< imgbox max-width="30%" img="/img/docs/v4/alert_list_panel.png" caption="Alert List Panel" >}}
|
||||
|
||||
This new panel allows you to show alert rules or a history of alert rule state changes. You can filter based on states your
|
||||
interested in. Very useful panel for overview style dashboards.
|
||||
This new panel allows you to show alert rules or a history of alert rule state changes. You can filter based on states you are
|
||||
interested in. This panel is very useful for overview style dashboards.
|
||||
|
||||
<div class="clearfix"></div>
|
||||
|
||||
@@ -79,8 +79,8 @@ interested in. Very useful panel for overview style dashboards.
|
||||
|
||||
{{< imgbox max-width="30%" img="/img/docs/v4/adhoc_filters.gif" caption="Ad-hoc filters variable" >}}
|
||||
|
||||
This is a new and very different type of template variable. It will allow you to create new key/value filters on the fly.
|
||||
With autocomplete for both key and values. The filter condition will be automatically applied to all
|
||||
This is a new and very different type of template variable. It will allow you to create new key/value filters on the fly
|
||||
with autocomplete for both key and values. The filter condition will be automatically applied to all
|
||||
queries that use that data source. This feature opens up more exploratory dashboards. In the gif animation to the right
|
||||
you have a dashboard for Elasticsearch log data. It uses one query variable that allow you to quickly change how the data
|
||||
is grouped, and an interval variable for controlling the granularity of the time buckets. What was missing
|
||||
@@ -126,15 +126,15 @@ We always try to bring some UX/UI refinements & polish in every release.
|
||||
|
||||
{{< imgbox max-width="50%" img="/img/docs/v4/add_panel.gif" caption="Add Panel flow" >}}
|
||||
|
||||
We spent a lot of time improving the dashboard building experience. Trying to make it both
|
||||
We spent a lot of time improving the dashboard building experience to make it both
|
||||
more efficient and easier for beginners. After many good but not great experiments
|
||||
with a `build mode` we eventually decided to just improve the green row menu and
|
||||
continue work on a `build mode` for a future release.
|
||||
|
||||
The new row menu automatically slides out when you mouse over the edge of the row. You no longer need
|
||||
to hover over the small green icon and the click it to expand the row menu.
|
||||
to hover over the small green icon and then click it to expand the row menu.
|
||||
|
||||
There is some minor improvements to drag and drop behaviour. Now when dragging a panel from one row
|
||||
There are some minor improvements to drag and drop behaviour. Now when dragging a panel from one row
|
||||
to another you will insert the panel and Grafana will automatically make room for it.
|
||||
When you drag a panel within a row you will simply reorder the panels.
|
||||
|
||||
@@ -150,7 +150,7 @@ We plan to further improve dashboard building in the future with a more rich gri
|
||||
{{< imgbox max-width="40%" img="/img/docs/v4/shortcuts.png" caption="Shortcuts" >}}
|
||||
|
||||
Grafana v4 introduces a number of really powerful keyboard shortcuts. You can now focus a panel
|
||||
by hovering over it with your mouse. With a panel focused you can simple hit `e` to toggle panel
|
||||
by hovering over it with your mouse. With a panel focused you can simply hit `e` to toggle panel
|
||||
edit mode, or `v` to toggle fullscreen mode. `p r` removes the panel. `p s` opens share
|
||||
modal.
|
||||
|
||||
@@ -164,10 +164,10 @@ Some nice navigation shortcuts are:
|
||||
|
||||
## Upgrade & Breaking changes
|
||||
|
||||
There are no breaking changes. Old dashboards and features should work the same. Grafana-server will automatically upgrade it's db
|
||||
There are no breaking changes. Old dashboards and features should work the same. Grafana-server will automatically upgrade its db
|
||||
schema on restart. It's advisable to do a backup of Grafana's database before updating.
|
||||
|
||||
If your are using plugins make sure to update your plugins as some might not work perfectly v4.
|
||||
If you are using plugins make sure to update your plugins as some might not work perfectly v4.
|
||||
|
||||
You can update plugins using grafana-cli
|
||||
|
||||
|
||||
@@ -280,14 +280,22 @@ Change password for specific user
|
||||
|
||||
## Pause all alerts
|
||||
|
||||
`DELETE /api/admin/pause-all-alerts`
|
||||
`POST /api/admin/pause-all-alerts`
|
||||
|
||||
**Example Request**:
|
||||
|
||||
DELETE /api/admin/pause-all-alerts HTTP/1.1
|
||||
POST /api/admin/pause-all-alerts HTTP/1.1
|
||||
Accept: application/json
|
||||
Content-Type: application/json
|
||||
|
||||
{
|
||||
"paused": true
|
||||
}
|
||||
|
||||
JSON Body schema:
|
||||
|
||||
- **paused** – If true then all alerts are to be paused, false unpauses all alerts.
|
||||
|
||||
**Example Response**:
|
||||
|
||||
HTTP/1.1 200
|
||||
|
||||
@@ -12,8 +12,8 @@ parent = "http_api"
|
||||
|
||||
# Alerting API
|
||||
|
||||
You can use the Alerting API to get information about alerts and their states but this API cannot be used to modify the alert.
|
||||
To create new alerts or modify them you need to update the dashboard json that contains the alerts.
|
||||
You can use the Alerting API to get information about alerts and their states but this API cannot be used to modify the alert.
|
||||
To create new alerts or modify them you need to update the dashboard json that contains the alerts.
|
||||
|
||||
This API can also be used to create, update and delete alert notifications.
|
||||
|
||||
@@ -28,6 +28,17 @@ This API can also be used to create, update and delete alert notifications.
|
||||
Content-Type: application/json
|
||||
Authorization: Bearer eyJrIjoiT0tTcG1pUlY2RnVKZTFVaDFsNFZXdE9ZWmNrMkZYbk
|
||||
|
||||
Querystring Parameters:
|
||||
|
||||
These parameters are used as querystring parameters. For example:
|
||||
|
||||
`/api/alerts?dashboardId=1`
|
||||
|
||||
- **dashboardId** – Return alerts for a specified dashboard.
|
||||
- **panelId** – Return alerts for a specified panel on a dashboard.
|
||||
- **limit** - Limit response to x number of alerts.
|
||||
- **state** - Return alerts with one or more of the following alert states: `ALL`,`no_data`, `paused`, `alerting`, `ok`, `pending`. To specify multiple states use the following format: `?state=paused&state=alerting`
|
||||
|
||||
**Example Response**:
|
||||
|
||||
HTTP/1.1 200
|
||||
@@ -40,6 +51,13 @@ This API can also be used to create, update and delete alert notifications.
|
||||
"name": "fire place sensor",
|
||||
"message": "Someone is trying to break in through the fire place",
|
||||
"state": "alerting",
|
||||
"evalDate": "0001-01-01T00:00:00Z",
|
||||
"evalData": [
|
||||
{
|
||||
"metric": "fire",
|
||||
"tags": null,
|
||||
"value": 5.349999999999999
|
||||
}
|
||||
"newStateDate": "2016-12-25",
|
||||
"executionError": "",
|
||||
"dashboardUri": "http://grafana.com/dashboard/db/sensors"
|
||||
@@ -73,7 +91,6 @@ This API can also be used to create, update and delete alert notifications.
|
||||
"dashboardUri": "http://grafana.com/dashboard/db/sensors"
|
||||
}
|
||||
|
||||
|
||||
## Pause alert
|
||||
|
||||
`POST /api/alerts/:id/pause`
|
||||
@@ -86,10 +103,15 @@ This API can also be used to create, update and delete alert notifications.
|
||||
Authorization: Bearer eyJrIjoiT0tTcG1pUlY2RnVKZTFVaDFsNFZXdE9ZWmNrMkZYbk
|
||||
|
||||
{
|
||||
"alertId": 1,
|
||||
"paused: true
|
||||
"paused": true
|
||||
}
|
||||
|
||||
The :id query parameter is the id of the alert to be paused or unpaused.
|
||||
|
||||
JSON Body Schema:
|
||||
|
||||
- **paused** – Can be `true` or `false`. True to pause an alert. False to unpause an alert.
|
||||
|
||||
**Example Response**:
|
||||
|
||||
HTTP/1.1 200
|
||||
@@ -111,11 +133,13 @@ This API can also be used to create, update and delete alert notifications.
|
||||
Content-Type: application/json
|
||||
Authorization: Bearer eyJrIjoiT0tTcG1pUlY2RnVKZTFVaDFsNFZXdE9ZWmNrMkZYbk
|
||||
|
||||
|
||||
|
||||
**Example Response**:
|
||||
|
||||
HTTP/1.1 200
|
||||
Content-Type: application/json
|
||||
|
||||
|
||||
{
|
||||
"id": 1,
|
||||
"name": "Team A",
|
||||
@@ -127,11 +151,11 @@ This API can also be used to create, update and delete alert notifications.
|
||||
|
||||
## Create alert notification
|
||||
|
||||
`POST /api/alerts-notifications`
|
||||
`POST /api/alert-notifications`
|
||||
|
||||
**Example Request**:
|
||||
|
||||
POST /api/alerts-notifications HTTP/1.1
|
||||
POST /api/alert-notifications HTTP/1.1
|
||||
Accept: application/json
|
||||
Content-Type: application/json
|
||||
Authorization: Bearer eyJrIjoiT0tTcG1pUlY2RnVKZTFVaDFsNFZXdE9ZWmNrMkZYbk
|
||||
@@ -144,29 +168,29 @@ This API can also be used to create, update and delete alert notifications.
|
||||
"addresses": "carl@grafana.com;dev@grafana.com"
|
||||
}
|
||||
}
|
||||
|
||||
|
||||
|
||||
**Example Response**:
|
||||
|
||||
HTTP/1.1 200
|
||||
Content-Type: application/json
|
||||
{
|
||||
"id": 1,
|
||||
"id": 1,
|
||||
"name": "new alert notification",
|
||||
"type": "email",
|
||||
"isDefault": false,
|
||||
"settings": { addresses: "carl@grafana.com;dev@grafana.com"} }
|
||||
"created": "2017-01-01 12:34",
|
||||
"created": "2017-01-01 12:34",
|
||||
"updated": "2017-01-01 12:34"
|
||||
}
|
||||
|
||||
## Update alert notification
|
||||
|
||||
`PUT /api/alerts-notifications/1`
|
||||
`PUT /api/alert-notifications/1`
|
||||
|
||||
**Example Request**:
|
||||
|
||||
PUT /api/alerts-notifications/1 HTTP/1.1
|
||||
PUT /api/alert-notifications/1 HTTP/1.1
|
||||
Accept: application/json
|
||||
Content-Type: application/json
|
||||
Authorization: Bearer eyJrIjoiT0tTcG1pUlY2RnVKZTFVaDFsNFZXdE9ZWmNrMkZYbk
|
||||
@@ -176,33 +200,33 @@ This API can also be used to create, update and delete alert notifications.
|
||||
"name": "new alert notification", //Required
|
||||
"type": "email", //Required
|
||||
"isDefault": false,
|
||||
"settings": {
|
||||
"settings": {
|
||||
"addresses: "carl@grafana.com;dev@grafana.com"
|
||||
}
|
||||
}
|
||||
|
||||
|
||||
|
||||
**Example Response**:
|
||||
|
||||
HTTP/1.1 200
|
||||
Content-Type: application/json
|
||||
{
|
||||
"id": 1,
|
||||
"id": 1,
|
||||
"name": "new alert notification",
|
||||
"type": "email",
|
||||
"isDefault": false,
|
||||
"settings": { addresses: "carl@grafana.com;dev@grafana.com"} }
|
||||
"created": "2017-01-01 12:34",
|
||||
"created": "2017-01-01 12:34",
|
||||
"updated": "2017-01-01 12:34"
|
||||
}
|
||||
|
||||
## Delete alert notification
|
||||
|
||||
`DELETE /api/alerts-notifications/:notificationId`
|
||||
`DELETE /api/alert-notifications/:notificationId`
|
||||
|
||||
**Example Request**:
|
||||
|
||||
DELETE /api/alerts-notifications/1 HTTP/1.1
|
||||
DELETE /api/alert-notifications/1 HTTP/1.1
|
||||
Accept: application/json
|
||||
Content-Type: application/json
|
||||
Authorization: Bearer eyJrIjoiT0tTcG1pUlY2RnVKZTFVaDFsNFZXdE9ZWmNrMkZYbk
|
||||
|
||||
@@ -41,3 +41,80 @@ You use the token in all requests in the `Authorization` header, like this:
|
||||
Authorization: Bearer eyJrIjoiT0tTcG1pUlY2RnVKZTFVaDFsNFZXdE9ZWmNrMkZYbk
|
||||
|
||||
The `Authorization` header value should be `Bearer <your api key>`.
|
||||
|
||||
# Auth HTTP resources / actions
|
||||
|
||||
## Api Keys
|
||||
|
||||
`GET /api/auth/keys`
|
||||
|
||||
**Example Request**:
|
||||
|
||||
GET /api/auth/keys HTTP/1.1
|
||||
Accept: application/json
|
||||
Content-Type: application/json
|
||||
Authorization: Bearer eyJrIjoiT0tTcG1pUlY2RnVKZTFVaDFsNFZXdE9ZWmNrMkZYbk
|
||||
|
||||
**Example Response**:
|
||||
|
||||
HTTP/1.1 200
|
||||
Content-Type: application/json
|
||||
|
||||
[
|
||||
{
|
||||
"id": 3,
|
||||
"name": "API",
|
||||
"role": "Admin"
|
||||
},
|
||||
{
|
||||
"id": 1,
|
||||
"name": "TestAdmin",
|
||||
"role": "Admin"
|
||||
}
|
||||
]
|
||||
|
||||
## Create API Key
|
||||
|
||||
`POST /api/auth/keys`
|
||||
|
||||
**Example Request**:
|
||||
|
||||
POST /api/auth/keys HTTP/1.1
|
||||
Accept: application/json
|
||||
Content-Type: application/json
|
||||
Authorization: Bearer eyJrIjoiT0tTcG1pUlY2RnVKZTFVaDFsNFZXdE9ZWmNrMkZYbk
|
||||
|
||||
{
|
||||
"name": "mykey",
|
||||
"role": "Admin"
|
||||
}
|
||||
|
||||
JSON Body schema:
|
||||
|
||||
- **name** – The key name
|
||||
- **role** – Sets the access level/Grafana Role for the key. Can be one of the following values: `Viewer`, `Editor`, `Read Only Editor` or `Admin`.
|
||||
|
||||
**Example Response**:
|
||||
|
||||
HTTP/1.1 200
|
||||
Content-Type: application/json
|
||||
|
||||
{"name":"mykey","key":"eyJrIjoiWHZiSWd3NzdCYUZnNUtibE9obUpESmE3bzJYNDRIc0UiLCJuIjoibXlrZXkiLCJpZCI6MX1="}
|
||||
|
||||
## Delete API Key
|
||||
|
||||
`DELETE /api/auth/keys/:id`
|
||||
|
||||
**Example Request**:
|
||||
|
||||
DELETE /api/auth/keys/3 HTTP/1.1
|
||||
Accept: application/json
|
||||
Content-Type: application/json
|
||||
Authorization: Bearer eyJrIjoiT0tTcG1pUlY2RnVKZTFVaDFsNFZXdE9ZWmNrMkZYbk
|
||||
|
||||
**Example Response**:
|
||||
|
||||
HTTP/1.1 200
|
||||
Content-Type: application/json
|
||||
|
||||
{"message":"API key deleted"}
|
||||
|
||||
@@ -19,26 +19,28 @@ Creates a new dashboard or updates an existing dashboard.
|
||||
|
||||
**Example Request for new dashboard**:
|
||||
|
||||
POST /api/dashboards/db HTTP/1.1
|
||||
Accept: application/json
|
||||
Content-Type: application/json
|
||||
Authorization: Bearer eyJrIjoiT0tTcG1pUlY2RnVKZTFVaDFsNFZXdE9ZWmNrMkZYbk
|
||||
```http
|
||||
POST /api/dashboards/db HTTP/1.1
|
||||
Accept: application/json
|
||||
Content-Type: application/json
|
||||
Authorization: Bearer eyJrIjoiT0tTcG1pUlY2RnVKZTFVaDFsNFZXdE9ZWmNrMkZYbk
|
||||
|
||||
{
|
||||
"dashboard": {
|
||||
"id": null,
|
||||
"title": "Production Overview",
|
||||
"tags": [ "templated" ],
|
||||
"timezone": "browser",
|
||||
"rows": [
|
||||
{
|
||||
}
|
||||
],
|
||||
"schemaVersion": 6,
|
||||
"version": 0
|
||||
},
|
||||
"overwrite": false
|
||||
}
|
||||
{
|
||||
"dashboard": {
|
||||
"id": null,
|
||||
"title": "Production Overview",
|
||||
"tags": [ "templated" ],
|
||||
"timezone": "browser",
|
||||
"rows": [
|
||||
{
|
||||
}
|
||||
],
|
||||
"schemaVersion": 6,
|
||||
"version": 0
|
||||
},
|
||||
"overwrite": false
|
||||
}
|
||||
```
|
||||
|
||||
JSON Body schema:
|
||||
|
||||
@@ -47,15 +49,17 @@ JSON Body schema:
|
||||
|
||||
**Example Response**:
|
||||
|
||||
HTTP/1.1 200 OK
|
||||
Content-Type: application/json; charset=UTF-8
|
||||
Content-Length: 78
|
||||
```http
|
||||
HTTP/1.1 200 OK
|
||||
Content-Type: application/json; charset=UTF-8
|
||||
Content-Length: 78
|
||||
|
||||
{
|
||||
"slug": "production-overview",
|
||||
"status": "success",
|
||||
"version": 1
|
||||
}
|
||||
{
|
||||
"slug": "production-overview",
|
||||
"status": "success",
|
||||
"version": 1
|
||||
}
|
||||
```
|
||||
|
||||
Status Codes:
|
||||
|
||||
@@ -67,14 +71,16 @@ Status Codes:
|
||||
The **412** status code is used when a newer dashboard already exists (newer, its version is greater than the version that was sent). The
|
||||
same status code is also used if another dashboard exists with the same title. The response body will look like this:
|
||||
|
||||
HTTP/1.1 412 Precondition Failed
|
||||
Content-Type: application/json; charset=UTF-8
|
||||
Content-Length: 97
|
||||
```http
|
||||
HTTP/1.1 412 Precondition Failed
|
||||
Content-Type: application/json; charset=UTF-8
|
||||
Content-Length: 97
|
||||
|
||||
{
|
||||
"message": "The dashboard has been changed by someone else",
|
||||
"status": "version-mismatch"
|
||||
}
|
||||
{
|
||||
"message": "The dashboard has been changed by someone else",
|
||||
"status": "version-mismatch"
|
||||
}
|
||||
```
|
||||
|
||||
In in case of title already exists the `status` property will be `name-exists`.
|
||||
|
||||
@@ -86,34 +92,38 @@ Will return the dashboard given the dashboard slug. Slug is the url friendly ver
|
||||
|
||||
**Example Request**:
|
||||
|
||||
GET /api/dashboards/db/production-overview HTTP/1.1
|
||||
Accept: application/json
|
||||
Content-Type: application/json
|
||||
Authorization: Bearer eyJrIjoiT0tTcG1pUlY2RnVKZTFVaDFsNFZXdE9ZWmNrMkZYbk
|
||||
```http
|
||||
GET /api/dashboards/db/production-overview HTTP/1.1
|
||||
Accept: application/json
|
||||
Content-Type: application/json
|
||||
Authorization: Bearer eyJrIjoiT0tTcG1pUlY2RnVKZTFVaDFsNFZXdE9ZWmNrMkZYbk
|
||||
```
|
||||
|
||||
**Example Response**:
|
||||
|
||||
HTTP/1.1 200
|
||||
Content-Type: application/json
|
||||
```http
|
||||
HTTP/1.1 200
|
||||
Content-Type: application/json
|
||||
|
||||
{
|
||||
"meta": {
|
||||
"isStarred": false,
|
||||
"slug": "production-overview"
|
||||
},
|
||||
"dashboard": {
|
||||
"id": null,
|
||||
"title": "Production Overview",
|
||||
"tags": [ "templated" ],
|
||||
"timezone": "browser",
|
||||
"rows": [
|
||||
{
|
||||
}
|
||||
],
|
||||
"schemaVersion": 6,
|
||||
"version": 0
|
||||
{
|
||||
"meta": {
|
||||
"isStarred": false,
|
||||
"slug": "production-overview"
|
||||
},
|
||||
"dashboard": {
|
||||
"id": null,
|
||||
"title": "Production Overview",
|
||||
"tags": [ "templated" ],
|
||||
"timezone": "browser",
|
||||
"rows": [
|
||||
{
|
||||
}
|
||||
}
|
||||
],
|
||||
"schemaVersion": 6,
|
||||
"version": 0
|
||||
}
|
||||
}
|
||||
```
|
||||
|
||||
## Delete dashboard
|
||||
|
||||
@@ -123,17 +133,21 @@ The above will delete the dashboard with the specified slug. The slug is the url
|
||||
|
||||
**Example Request**:
|
||||
|
||||
DELETE /api/dashboards/db/test HTTP/1.1
|
||||
Accept: application/json
|
||||
Content-Type: application/json
|
||||
Authorization: Bearer eyJrIjoiT0tTcG1pUlY2RnVKZTFVaDFsNFZXdE9ZWmNrMkZYbk
|
||||
```http
|
||||
DELETE /api/dashboards/db/test HTTP/1.1
|
||||
Accept: application/json
|
||||
Content-Type: application/json
|
||||
Authorization: Bearer eyJrIjoiT0tTcG1pUlY2RnVKZTFVaDFsNFZXdE9ZWmNrMkZYbk
|
||||
```
|
||||
|
||||
**Example Response**:
|
||||
|
||||
HTTP/1.1 200
|
||||
Content-Type: application/json
|
||||
```http
|
||||
HTTP/1.1 200
|
||||
Content-Type: application/json
|
||||
|
||||
{"title": "Test"}
|
||||
{"title": "Test"}
|
||||
```
|
||||
|
||||
## Gets the home dashboard
|
||||
|
||||
@@ -221,10 +235,6 @@ Get all tags of dashboards
|
||||
}
|
||||
]
|
||||
|
||||
## Dashboard from JSON file
|
||||
|
||||
`GET /file/:file`
|
||||
|
||||
## Search Dashboards
|
||||
|
||||
`GET /api/search/`
|
||||
@@ -232,7 +242,7 @@ Get all tags of dashboards
|
||||
Status Codes:
|
||||
|
||||
- **query** – Search Query
|
||||
- **tags** – Tags to use
|
||||
- **tag** – Tag to use
|
||||
- **starred** – Flag indicating if only starred Dashboards should be returned
|
||||
- **tagcloud** - Flag indicating if a tagcloud should be returned
|
||||
|
||||
|
||||
@@ -48,16 +48,16 @@ Default value for the `perpage` parameter is `1000` and for the `page` parameter
|
||||
|
||||
## Search Users with Paging
|
||||
|
||||
`GET /api/users/search?perpage=10&page=1`
|
||||
`GET /api/users/search?perpage=10&page=1&query=mygraf`
|
||||
|
||||
**Example Request**:
|
||||
|
||||
GET /api/users/search?perpage=10&page=1 HTTP/1.1
|
||||
GET /api/users/search?perpage=10&page=1&query=mygraf HTTP/1.1
|
||||
Accept: application/json
|
||||
Content-Type: application/json
|
||||
Authorization: Bearer eyJrIjoiT0tTcG1pUlY2RnVKZTFVaDFsNFZXdE9ZWmNrMkZYbk
|
||||
|
||||
Default value for the `perpage` parameter is `1000` and for the `page` parameter is `1`. The `totalCount` field in the response can be used for pagination of the user list E.g. if `totalCount` is equal to 100 users and the `perpage` parameter is set to 10 then there are 10 pages of users.
|
||||
Default value for the `perpage` parameter is `1000` and for the `page` parameter is `1`. The `totalCount` field in the response can be used for pagination of the user list E.g. if `totalCount` is equal to 100 users and the `perpage` parameter is set to 10 then there are 10 pages of users. The `query` parameter is optional and it will return results where the query value is contained in one of the `name`, `login` or `email` fields. Query values with spaces need to be url encoded e.g. `query=Jane%20Doe`.
|
||||
|
||||
**Example Response**:
|
||||
|
||||
|
||||
@@ -1,8 +1,9 @@
|
||||
+++
|
||||
title = "Grafana Documentation Site"
|
||||
title = "Docs Home"
|
||||
description = "Install guide for Grafana"
|
||||
keywords = ["grafana", "installation", "documentation"]
|
||||
type = "docs"
|
||||
aliases = ["v1.1", "guides/reference/admin"]
|
||||
[menu.docs]
|
||||
name = "Welcome to the Docs"
|
||||
identifier = "root"
|
||||
@@ -30,15 +31,15 @@ instructions for more information.
|
||||
## Configuring Grafana
|
||||
|
||||
The back-end web server has a number of configuration options. Go the
|
||||
[Configuration](/installation/configuration) page for details on all
|
||||
[Configuration]({{< relref "installation/configuration.md" >}}) page for details on all
|
||||
those options.
|
||||
|
||||
|
||||
## Getting started
|
||||
|
||||
- [Getting Started](guides/getting_started)
|
||||
- [Basic Concepts](guides/basic_concepts)
|
||||
- [Screencasts](tutorials/screencasts)
|
||||
- [Getting Started]({{< relref "guides/getting_started.md" >}})
|
||||
- [Basic Concepts]({{< relref "guides/basic_concepts.md" >}})
|
||||
- [Screencasts]({{< relref "tutorials/screencasts.md" >}})
|
||||
|
||||
## Data sources guides
|
||||
|
||||
|
||||
@@ -23,16 +23,18 @@ domain = foo.bar
|
||||
To use sub *path* ex `http://foo.bar/grafana` make sure to include `/grafana` in the end of root_url.
|
||||
Otherwise Grafana will not behave correctly. See example below.
|
||||
|
||||
# Examples
|
||||
## Examples
|
||||
Here are some example configurations for running Grafana behind a reverse proxy.
|
||||
|
||||
## Grafana configuration (ex http://foo.bar.com)
|
||||
### Grafana configuration (ex http://foo.bar.com)
|
||||
|
||||
```
|
||||
[server]
|
||||
domain = foo.bar
|
||||
```
|
||||
|
||||
## Nginx configuration
|
||||
### Nginx configuration
|
||||
|
||||
```
|
||||
server {
|
||||
listen 80;
|
||||
@@ -45,16 +47,16 @@ server {
|
||||
}
|
||||
```
|
||||
|
||||
# Examples with **sub path** (ex http://foo.bar.com/grafana)
|
||||
### Examples with **sub path** (ex http://foo.bar.com/grafana)
|
||||
|
||||
## Grafana configuration with sub path
|
||||
#### Grafana configuration with sub path
|
||||
```
|
||||
[server]
|
||||
domain = foo.bar
|
||||
root_url = %(protocol)s://%(domain)s:/grafana
|
||||
```
|
||||
|
||||
## Nginx configuration with sub path
|
||||
#### Nginx configuration with sub path
|
||||
```
|
||||
server {
|
||||
listen 80;
|
||||
|
||||
@@ -229,6 +229,10 @@ Used for signing keep me logged in / remember me cookies.
|
||||
Set to `true` to disable the use of Gravatar for user profile images.
|
||||
Default is `false`.
|
||||
|
||||
### data_source_proxy_whitelist
|
||||
|
||||
Define a white list of allowed ips/domains to use in data sources. Format: `ip_or_domain:port` separated by spaces
|
||||
|
||||
<hr />
|
||||
|
||||
## [users]
|
||||
@@ -267,6 +271,10 @@ options are `Admin` and `Editor` and `Read Only Editor`. e.g. :
|
||||
|
||||
Set to true to disable (hide) the login form, useful if you use OAuth, defaults to false.
|
||||
|
||||
### disable_signout_menu
|
||||
|
||||
Set to true to disable the signout link in the side menu. useful if you use auth.proxy, defaults to false.
|
||||
|
||||
<hr>
|
||||
|
||||
## [auth.anonymous]
|
||||
@@ -309,7 +317,6 @@ example:
|
||||
auth_url = https://github.com/login/oauth/authorize
|
||||
token_url = https://github.com/login/oauth/access_token
|
||||
api_url = https://api.github.com/user
|
||||
allow_sign_up = false
|
||||
team_ids =
|
||||
allowed_organizations =
|
||||
|
||||
@@ -410,7 +417,7 @@ browser to access Grafana, but with the prefix path of `/login/generic_oauth`.
|
||||
allowed_domains = mycompany.com mycompany.org
|
||||
allow_sign_up = true
|
||||
|
||||
Set api_url to the resource that returns basic user info.
|
||||
Set api_url to the resource that returns [OpenID UserInfo](https://connect2id.com/products/server/docs/api/userinfo) compatible information.
|
||||
|
||||
<hr>
|
||||
|
||||
@@ -427,6 +434,11 @@ Set to `true` to enable LDAP integration (default: `false`)
|
||||
### config_file
|
||||
Path to the LDAP specific configuration file (default: `/etc/grafana/ldap.toml`)
|
||||
|
||||
### allow_sign_up
|
||||
|
||||
Allow sign up should almost always be true (default) to allow new Grafana users to be created (if ldap authentication is ok). If set to
|
||||
false only pre-existing Grafana users will be able to login (if ldap authentication is ok).
|
||||
|
||||
> For details on LDAP Configuration, go to the [LDAP Integration]({{< relref "ldap.md" >}}) page.
|
||||
|
||||
<hr>
|
||||
@@ -635,6 +647,9 @@ Secret key. e.g. AAAAAAAAAAAAAAAAAAAAAAAAAAAAAAAAAAAAAAAA
|
||||
### url
|
||||
Url to where Grafana will send PUT request with images
|
||||
|
||||
### public_url
|
||||
Optional parameter. Url to send to users in notifications, directly appended with the resulting uploaded file name.
|
||||
|
||||
### username
|
||||
basic auth username
|
||||
|
||||
|
||||
@@ -15,23 +15,17 @@ weight = 1
|
||||
|
||||
Description | Download
|
||||
------------ | -------------
|
||||
Stable for Debian-based Linux | [4.1.2 (x86-64 deb)](https://grafanarel.s3.amazonaws.com/builds/grafana_4.1.2-1486989747_amd64.deb)
|
||||
Beta for Debian-based Linux | [4.2.0-beta1 (x86-64 deb)](https://grafanarel.s3.amazonaws.com/builds/grafana_4.2.0-beta1_amd64.deb)
|
||||
Stable for Debian-based Linux | [4.2.0 (x86-64 deb)](https://s3-us-west-2.amazonaws.com/grafana-releases/release/grafana_4.2.0_amd64.deb)
|
||||
|
||||
Read [Upgrading Grafana]({{< relref "installation/upgrading.md" >}}) for tips and guidance on updating an existing
|
||||
installation.
|
||||
|
||||
## Install Stable
|
||||
|
||||
```
|
||||
$ wget https://grafanarel.s3.amazonaws.com/builds/grafana_4.1.2-1486989747_amd64.deb
|
||||
$ sudo apt-get install -y adduser libfontconfig
|
||||
$ sudo dpkg -i grafana_4.1.2-1486989747_amd64.deb
|
||||
```
|
||||
|
||||
## Install Beta
|
||||
|
||||
```
|
||||
$ wget https://grafanarel.s3.amazonaws.com/builds/grafana_4.2.0-beta1_amd64.deb
|
||||
$ sudo apt-get install -y adduser libfontconfig
|
||||
$ sudo dpkg -i grafana_4.2.0-beta1_amd64.deb
|
||||
```bash
|
||||
wget https://s3-us-west-2.amazonaws.com/grafana-releases/release/grafana_4.2.0_amd64.deb
|
||||
sudo apt-get install -y adduser libfontconfig
|
||||
sudo dpkg -i grafana_4.2.0_amd64.deb
|
||||
```
|
||||
|
||||
## APT Repository
|
||||
@@ -49,18 +43,24 @@ candidates.
|
||||
Then add the [Package Cloud](https://packagecloud.io/grafana) key. This
|
||||
allows you to install signed packages.
|
||||
|
||||
$ curl https://packagecloud.io/gpg.key | sudo apt-key add -
|
||||
```bash
|
||||
curl https://packagecloud.io/gpg.key | sudo apt-key add -
|
||||
```
|
||||
|
||||
Update your Apt repositories and install Grafana
|
||||
|
||||
$ sudo apt-get update
|
||||
$ sudo apt-get install grafana
|
||||
```bash
|
||||
sudo apt-get update
|
||||
sudo apt-get install grafana
|
||||
```
|
||||
|
||||
On some older versions of Ubuntu and Debian you may need to install the
|
||||
`apt-transport-https` package which is needed to fetch packages over
|
||||
HTTPS.
|
||||
|
||||
$ sudo apt-get install -y apt-transport-https
|
||||
```bash
|
||||
sudo apt-get install -y apt-transport-https
|
||||
```
|
||||
|
||||
## Package details
|
||||
|
||||
@@ -76,7 +76,9 @@ HTTPS.
|
||||
|
||||
Start Grafana by running:
|
||||
|
||||
$ sudo service grafana-server start
|
||||
```bash
|
||||
sudo service grafana-server start
|
||||
```
|
||||
|
||||
This will start the `grafana-server` process as the `grafana` user,
|
||||
which was created during the package installation. The default HTTP port
|
||||
@@ -84,19 +86,25 @@ is `3000` and default user and group is `admin`.
|
||||
|
||||
To configure the Grafana server to start at boot time:
|
||||
|
||||
$ sudo update-rc.d grafana-server defaults
|
||||
```bash
|
||||
sudo update-rc.d grafana-server defaults
|
||||
```
|
||||
|
||||
## Start the server (via systemd)
|
||||
|
||||
To start the service using systemd:
|
||||
|
||||
$ systemctl daemon-reload
|
||||
$ systemctl start grafana-server
|
||||
$ systemctl status grafana-server
|
||||
```bash
|
||||
systemctl daemon-reload
|
||||
systemctl start grafana-server
|
||||
systemctl status grafana-server
|
||||
```
|
||||
|
||||
Enable the systemd service so that Grafana starts at boot.
|
||||
|
||||
sudo systemctl enable grafana-server.service
|
||||
```bash
|
||||
sudo systemctl enable grafana-server.service
|
||||
```
|
||||
|
||||
## Environment file
|
||||
|
||||
|
||||
@@ -3,7 +3,7 @@ title = "Installation"
|
||||
description = "Install guide for Grafana"
|
||||
keywords = ["grafana", "installation", "documentation"]
|
||||
type = "docs"
|
||||
aliases = ["installation/installation/"]
|
||||
aliases = ["installation/installation/", "v2.1/installation/install/"]
|
||||
[menu.docs]
|
||||
name = "Installation"
|
||||
identifier = "installation"
|
||||
|
||||
@@ -38,7 +38,7 @@ start_tls = false
|
||||
# set to true if you want to skip ssl cert validation
|
||||
ssl_skip_verify = false
|
||||
# set to the path to your root CA certificate or leave unset to use system defaults
|
||||
# root_ca_cert = /path/to/certificate.crt
|
||||
# root_ca_cert = "/path/to/certificate.crt"
|
||||
|
||||
# Search user bind dn
|
||||
bind_dn = "cn=admin,dc=grafana,dc=org"
|
||||
@@ -73,7 +73,7 @@ email = "email"
|
||||
[[servers.group_mappings]]
|
||||
group_dn = "cn=admins,dc=grafana,dc=org"
|
||||
org_role = "Admin"
|
||||
# The Grafana organization database id, optional, if left out the default org (id 1) will be used
|
||||
# The Grafana organization database id, optional, if left out the default org (id 1) will be used. Setting this allows for multiple group_dn's to be assigned to the same org_role provided the org_id differs
|
||||
# org_id = 1
|
||||
|
||||
[[servers.group_mappings]]
|
||||
|
||||
@@ -3,9 +3,6 @@ title = "Migrating from older versions"
|
||||
description = "Upgrading & Migrating Grafana from older versions"
|
||||
keywords = ["grafana", "configuration", "documentation", "migration"]
|
||||
type = "docs"
|
||||
[menu.docs]
|
||||
parent = "installation"
|
||||
weight = 10
|
||||
+++
|
||||
|
||||
# Migrating from older versions
|
||||
|
||||
@@ -1,33 +0,0 @@
|
||||
+++
|
||||
title = "Installing via provisioning tools"
|
||||
description = "Guide to install Grafana via provisioning tools like puppet & chef"
|
||||
keywords = ["grafana", "provisioning", "documentation", "puppet", "chef", "ansible"]
|
||||
type = "docs"
|
||||
[menu.docs]
|
||||
parent = "installation"
|
||||
weight = 8
|
||||
+++
|
||||
|
||||
|
||||
# Installing via provisioning tools
|
||||
|
||||
Here are links for how to install Grafana (and some include Graphite or
|
||||
InfluxDB as well) via a provisioning system. These are not maintained by
|
||||
any core Grafana team member and might be out of date.
|
||||
|
||||
### Puppet
|
||||
|
||||
* [forge.puppetlabs.com/bfraser/grafana](https://forge.puppetlabs.com/bfraser/grafana)
|
||||
|
||||
### Ansible
|
||||
|
||||
* [github.com/picotrading/ansible-grafana](https://github.com/picotrading/ansible-grafana)
|
||||
|
||||
### Docker
|
||||
* [github.com/grafana/grafana-docker](https://github.com/grafana/grafana-docker)
|
||||
|
||||
### Chef
|
||||
|
||||
* [github.com/JonathanTron/chef-grafana](https://github.com/JonathanTron/chef-grafana)
|
||||
* [github.com/Nordstrom/grafana2-cookbook](https://github.com/Nordstrom/grafana2-cookbook)
|
||||
|
||||
@@ -15,25 +15,28 @@ weight = 2
|
||||
|
||||
Description | Download
|
||||
------------ | -------------
|
||||
Stable for CentOS / Fedora / OpenSuse / Redhat Linux | [4.1.2 (x86-64 rpm)](https://grafanarel.s3.amazonaws.com/builds/grafana-4.1.2-1486989747.x86_64.rpm)
|
||||
Beta for CentOS / Fedora / OpenSuse / Redhat Linux | [4.2.0-beta1 (x86-64 rpm)](https://grafanarel.s3.amazonaws.com/builds/grafana-4.2.0-beta1.x86_64.rpm)
|
||||
Stable for CentOS / Fedora / OpenSuse / Redhat Linux | [4.2.0 (x86-64 rpm)](https://s3-us-west-2.amazonaws.com/grafana-releases/release/grafana-4.2.0-1.x86_64.rpm)
|
||||
|
||||
Read [Upgrading Grafana]({{< relref "installation/upgrading.md" >}}) for tips and guidance on updating an existing
|
||||
installation.
|
||||
|
||||
## Install Stable
|
||||
|
||||
You can install Grafana using Yum directly.
|
||||
|
||||
$ sudo yum install https://grafanarel.s3.amazonaws.com/builds/grafana-4.1.2-1486989747.x86_64.rpm
|
||||
$ sudo yum install https://s3-us-west-2.amazonaws.com/grafana-releases/release/grafana-4.2.0-1.x86_64.rpm
|
||||
|
||||
Or install manually using `rpm`.
|
||||
|
||||
#### On CentOS / Fedora / Redhat:
|
||||
|
||||
$ wget https://s3-us-west-2.amazonaws.com/grafana-releases/release/grafana-4.2.0-1.x86_64.rpm
|
||||
$ sudo yum install initscripts fontconfig
|
||||
$ sudo rpm -Uvh grafana-4.1.2-1486989747.x86_64.rpm
|
||||
$ sudo rpm -Uvh grafana-4.2.0-1.x86_64.rpm
|
||||
|
||||
#### On OpenSuse:
|
||||
|
||||
$ sudo rpm -i --nodeps grafana-4.1.2-1486989747.x86_64.rpm
|
||||
$ sudo rpm -i --nodeps grafana-4.2.0-1.x86_64.rpm
|
||||
|
||||
## Install via YUM Repository
|
||||
|
||||
|
||||
@@ -11,48 +11,24 @@ weight = 8
|
||||
|
||||
# Troubleshooting
|
||||
|
||||
This page is dedicated to helping you solve any problem you have getting
|
||||
Grafana to work. Please review it before opening a new [GitHub
|
||||
issue](https://github.com/grafana/grafana/issues/new) or asking a
|
||||
question in the `#grafana` IRC channel on freenode.
|
||||
## visualization & query issues
|
||||
|
||||
## General connection issues
|
||||
The most common problems are related to the query & response from you data source. Even if it looks
|
||||
like a bug or visualization issue in Grafana it is 99% of time a problem with the data source query or
|
||||
the data source response.
|
||||
|
||||
When setting up Grafana for the first time you might experience issues
|
||||
with Grafana being unable to query Graphite, OpenTSDB or InfluxDB. You
|
||||
might not be able to get metric name completion or the graph might show
|
||||
an error like this:
|
||||
So make sure to check the query sent and the raw response, learn how in this guide: [How to troubleshoot metric query issues](https://community.grafana.com/t/how-to-troubleshoot-metric-query-issues/50)
|
||||
|
||||

|
||||
## Logging
|
||||
|
||||
For some types of errors, the `View details` link will show you error
|
||||
details. For many types of HTTP connection errors, however, there is very
|
||||
little information. The best way to troubleshoot these issues is use
|
||||
the [Chrome developer tools](https://developer.chrome.com/devtools/index).
|
||||
By pressing `F12` you can bring up the chrome dev tools.
|
||||
If you encounter an error or problem it is a good idea to check the grafana server log. Usually
|
||||
located at `/var/log/grafana/grafana.log` on unix systems or in `<grafana_install_dir>/data/log` on
|
||||
other platforms & manual installs.
|
||||
|
||||

|
||||
You can enable more logging by changing log level in you grafana configuration file.
|
||||
|
||||
There are two important tabs in the Chrome developer tools: `Network`
|
||||
and `Console`. The `Console` tab will show you Javascript errors and
|
||||
HTTP request errors. In the Network tab you will be able to identify the
|
||||
request that failed and review request and response parameters. This
|
||||
information will be of great help in finding the cause of the error.
|
||||
## FAQ
|
||||
|
||||
If you are unable to solve the issue, even after reading the remainder
|
||||
of this troubleshooting guide, you should open a [GitHub support
|
||||
issue](https://github.com/grafana/grafana/issues). Before you do that
|
||||
please search the existing closed or open issues. Also if you need to
|
||||
create a support issue, screen shots and or text information about the
|
||||
chrome console error, request and response information from the
|
||||
`Network` tab in Chrome developer tools are of great help.
|
||||
|
||||
### Inspecting Grafana metric requests
|
||||
|
||||

|
||||
|
||||
After opening the Chrome developer tools for the first time the
|
||||
`Network` tab is empty. You will need to refresh the page to get
|
||||
requests to show. For some type of errors, especially CORS-related,
|
||||
there might not be a response at all.
|
||||
Checkout the [FAQ](https://community.grafana.com/c/howto/faq) section on our community page for frequently
|
||||
asked questions.
|
||||
|
||||
|
||||
@@ -0,0 +1,103 @@
|
||||
+++
|
||||
title = "Upgrading"
|
||||
description = "Upgrading Grafana guide"
|
||||
keywords = ["grafana", "configuration", "documentation", "upgrade"]
|
||||
type = "docs"
|
||||
[menu.docs]
|
||||
name = "Upgrading"
|
||||
identifier = "upgrading"
|
||||
parent = "installation"
|
||||
weight = 10
|
||||
+++
|
||||
|
||||
# Upgrading Grafana
|
||||
|
||||
We recommend everyone to upgrade Grafana often to stay up to date with the latest fixes and enhancements.
|
||||
In order make this a reality Grafana upgrades are backward compatible and the upgrade process is simple & quick.
|
||||
|
||||
Upgrading is generally always safe (between many minor and one major version) and dashboards and graphs will look the same. There can be minor breaking changes in some edge cases which are usually outlined in the [Release Notes](https://community.grafana.com/c/releases) and [Changelog](https://github.com/grafana/grafana/blob/master/CHANGELOG.md)
|
||||
|
||||
## Database Backup
|
||||
|
||||
Before upgrading it can be a good idea to backup your Grafana database. This will ensure that you can always rollback to your previous version. During startup, Grafana will automatically migrate the database schema (if there are changes or new tables). Sometimes this can cause issues if you later want to downgrade.
|
||||
|
||||
#### sqlite
|
||||
|
||||
If you use sqlite you only need to make a backup of you `grafana.db` file. This is usually located at `/var/lib/grafana/grafana.db` on unix system.
|
||||
If you are unsure what database you use and where it is stored check you grafana configuration file. If you
|
||||
installed grafana to custom location using a binary tar/zip it is usally in `<grafana_install_dir>/data`.
|
||||
|
||||
#### mysql
|
||||
|
||||
```
|
||||
backup:
|
||||
> mysqldump -u root -p[root_password] [grafana] > grafana_backup.sql
|
||||
|
||||
restore:
|
||||
> mysql -u root -p grafana < grafana_backup.sql
|
||||
```
|
||||
|
||||
#### postgres
|
||||
|
||||
```
|
||||
backup:
|
||||
> pg_dump grafana > grafana_backup
|
||||
|
||||
restore:
|
||||
> psql grafana < grafana_backup
|
||||
```
|
||||
|
||||
### Ubuntu / Debian
|
||||
|
||||
If you installed grafana by downloading a debian package (`.deb`) you can just follow the same installation guide
|
||||
and execute the same `dpkg -i` command but with the new package. It will upgrade your Grafana install.
|
||||
|
||||
If you used our APT repository:
|
||||
|
||||
```
|
||||
sudo apt-get update
|
||||
sudo apt-get install grafana
|
||||
```
|
||||
|
||||
#### Upgrading from binary tar file
|
||||
|
||||
If you downloaded the binary tar package you can just download and extract a new package
|
||||
and overwrite all your existing files. But this might overwrite your config changes. We
|
||||
recommend you place your config changes in a file named `<grafana_install_dir>/conf/custom.ini`
|
||||
as this will make upgrades easier without risking losing your config changes.
|
||||
|
||||
### Centos / RHEL
|
||||
|
||||
If you installed grafana by downloading a rpm package you can just follow the same installation guide
|
||||
and execute the same `yum install` or `rpm -i` command but with the new package. It will upgrade your Grafana install.
|
||||
|
||||
If you used our YUM repository:
|
||||
|
||||
```
|
||||
sudo yum update grafana
|
||||
```
|
||||
|
||||
### Docker
|
||||
|
||||
This just an example, details depend on how you configured your grafana container.
|
||||
```
|
||||
docker pull grafana
|
||||
docker stop my-grafana-container
|
||||
docker rm my-grafana-container
|
||||
docker run --name=my-grafana-container --restart=always -v /var/lib/grafana:/var/lib/grafana
|
||||
```
|
||||
|
||||
### Windows
|
||||
|
||||
If you downloaded the windows binary package you can just download a newer package and extract
|
||||
to the same location (and overwrite the existing files). This might overwrite your config changes. We
|
||||
recommend you place your config changes in a file named `<grafana_install_dir>/conf/custom.ini`
|
||||
as this will make upgrades easier without risking losing your config changes.
|
||||
|
||||
## Upgrading form 1.x
|
||||
|
||||
[Migrating from 1.x to 2.x]({{< relref "installation/migrating_to2.md" >}})
|
||||
|
||||
## Upgrading form 2.x
|
||||
|
||||
We are not aware of any issues upgrading directly from 2.x to 4.x but to on the safe side go via 3.x.
|
||||
@@ -13,8 +13,10 @@ weight = 3
|
||||
|
||||
Description | Download
|
||||
------------ | -------------
|
||||
Latest stable package for Windows | [grafana.4.1.2.windows-x64.zip](https://grafanarel.s3.amazonaws.com/builds/grafana-4.1.2.windows-x64.zip)
|
||||
Latest beta package for Windows | [grafana-4.2.0-beta1.windows-x64.zip](https://grafanarel.s3.amazonaws.com/builds/grafana-4.2.0-beta1.windows-x64.zip)
|
||||
Latest stable package for Windows | [grafana.4.2.0.windows-x64.zip](https://s3-us-west-2.amazonaws.com/grafana-releases/release/grafana-4.2.0.windows-x64.zip)
|
||||
|
||||
Read [Upgrading Grafana]({{< relref "installation/upgrading.md" >}}) for tips and guidance on updating an existing
|
||||
installation.
|
||||
|
||||
## Configure
|
||||
|
||||
|
||||
@@ -13,7 +13,7 @@ This guide has two parts. The first part describes the metadata and the second p
|
||||
|
||||
## Metadata
|
||||
|
||||
The plugin metadata consists of a plugin.json file and the README.md file. These two files are used by Grafana and Grafana.net.
|
||||
The plugin metadata consists of a plugin.json file and the README.md file. These two files are used by Grafana and Grafana.com.
|
||||
|
||||
### Plugin.json (mandatory)
|
||||
|
||||
|
||||
@@ -17,7 +17,7 @@ There are two blog posts about authoring a plugin that might also be of interest
|
||||
## Short version
|
||||
|
||||
1. [Setup grafana](http://docs.grafana.org/project/building_from_source/)
|
||||
2. Clone an example plugin into ```/var/lib/grafana/plugins``` or `data/plugins` (relative to grafana git repo if your running development version from source dir)
|
||||
2. Clone an example plugin into ```/var/lib/grafana/plugins``` or `data/plugins` (relative to grafana git repo if you're running development version from source dir)
|
||||
3. Code away!
|
||||
|
||||
## What languages?
|
||||
|
||||
@@ -19,7 +19,7 @@ The plugin.json file is mandatory for all plugins. When Grafana starts it will s
|
||||
| id | unique name of the plugin - [conventions described in styleguide]({{< relref "code-styleguide.md" >}}) |
|
||||
| type | panel/datasource/app |
|
||||
| name | Human readable name of the plugin |
|
||||
| info.description | Description of plugin. Used for searching grafana net plugins |
|
||||
| info.description | Description of plugin. Used for searching grafana.com plugins |
|
||||
| info.author | |
|
||||
| info.keywords | plugin keywords. Used for search on grafana net|
|
||||
| info.logos | link to project logos |
|
||||
|
||||
@@ -1,5 +1,6 @@
|
||||
+++
|
||||
title = "Plugins"
|
||||
type = "docs"
|
||||
[menu.docs]
|
||||
name = "Plugins"
|
||||
identifier = "plugins"
|
||||
@@ -9,16 +10,11 @@ weight = 8
|
||||
|
||||
# Plugins
|
||||
|
||||
From Grafana 3.0 not only datasource plugins are supported but also panel plugins and apps.
|
||||
Having panels as plugins make it easy to create and add any kind of panel, to show your data
|
||||
or improve your favorite dashboards. Apps is something new in Grafana that enables
|
||||
bundling of datasources, panels, dashboards and Grafana pages into a cohesive experience.
|
||||
Plugins make it easy to create and add any kind of panel, data source or complete
|
||||
application, to show your data or improve your favorite dashboards.
|
||||
|
||||
Grafana already have a strong community of contributors and plugin developers.
|
||||
Grafana has a strong community of contributors and plugin developers.
|
||||
By making it easier to develop and install plugins we hope that the community
|
||||
can grow even stronger and develop new plugins that we would never think about.
|
||||
|
||||
You can discover available plugins on [Grafana.net](https://grafana.net)
|
||||
|
||||
|
||||
|
||||
You can discover available plugins on [Grafana.com](https://grafana.com/plugins)
|
||||
|
||||
@@ -17,17 +17,17 @@ Grafana already have a strong community of contributors and plugin developers.
|
||||
By making it easier to develop and install plugins we hope that the community
|
||||
can grow even stronger and develop new plugins that we would never think about.
|
||||
|
||||
To discover plugins checkout the official [Plugin Repository](https://grafana.net/plugins).
|
||||
To discover plugins checkout the official [Plugin Repository](https://grafana.com/plugins).
|
||||
|
||||
# Installing plugins
|
||||
# Installing Plugins
|
||||
|
||||
The easiest way to install plugins is by using the CLI tool grafana-cli which is bundled with grafana. Before any modification take place after modifying plugins, grafana-server needs to be restarted.
|
||||
|
||||
### Grafana plugin directory
|
||||
### Grafana Plugin Directory
|
||||
|
||||
On Linux systems the grafana-cli will assume that the grafana plugin directory is `/var/lib/grafana/plugins`. It's possible to override the directory which grafana-cli will operate on by specifying the --pluginsDir flag. On Windows systems this parameter have to be specified for every call.
|
||||
|
||||
### Grafana-cli commands
|
||||
### Grafana-cli Commands
|
||||
|
||||
List available plugins
|
||||
```
|
||||
@@ -63,3 +63,42 @@ Remove one plugin
|
||||
```
|
||||
grafana-cli plugins remove <plugin-id>
|
||||
```
|
||||
|
||||
### Installing Plugins Manually
|
||||
|
||||
If your Grafana Server does not have access to the Internet, then the plugin will have to downloaded and manually copied to your Grafana Server.
|
||||
|
||||
The Download URL from Grafana.com API is in this form:
|
||||
|
||||
`https://grafana.com/api/plugins/<plugin id>/versions/<version number>/download`
|
||||
|
||||
To manually install a Plugin via the Grafana.com API:
|
||||
|
||||
1. Find the plugin you want to download, the plugin id can be found on the Installation Tab on the plugin's page on Grafana.com. In this example, the plugin id is `jdbranham-diagram-panel`:
|
||||
|
||||
{{< imgbox img="/img/docs/installation-tab.png" caption="Installation Tab" >}}
|
||||
|
||||
2. Use the Grafana API to find the plugin using this url `https://grafana.com/api/plugins/<plugin id from step 1>`. For example: https://grafana.com/api/plugins/jdbranham-diagram-panel should return:
|
||||
```
|
||||
{
|
||||
"id": 145,
|
||||
"typeId": 3,
|
||||
"typeName": "Panel",
|
||||
"typeCode": "panel",
|
||||
"slug": "jdbranham-diagram-panel",
|
||||
"name": "Diagram",
|
||||
"description": "Diagram panel for grafana",
|
||||
...
|
||||
```
|
||||
|
||||
3. Find the download link:
|
||||
```
|
||||
{
|
||||
"rel": "download",
|
||||
"href": "/plugins/jdbranham-diagram-panel/versions/1.4.0/download"
|
||||
}
|
||||
```
|
||||
|
||||
4. Download the plugin with `https://grafana.com/api/plugins/<plugin id from step 1>/versions/<current version>/download` (for example: https://grafana.com/api/plugins/jdbranham-diagram-panel/versions/1.4.0/download). Unzip the downloaded file into the Grafana Server's `data/plugins` directory.
|
||||
|
||||
5. Restart the Grafana Server.
|
||||
|
||||
@@ -13,8 +13,8 @@ dev environment. Grafana ships with its own required backend server; also comple
|
||||
|
||||
## Dependencies
|
||||
|
||||
- [Go 1.8](https://golang.org/dl/)
|
||||
- [NodeJS](https://nodejs.org/download/)
|
||||
- [Go 1.8.1](https://golang.org/dl/)
|
||||
- [NodeJS LTS](https://nodejs.org/download/)
|
||||
|
||||
## Get Code
|
||||
Create a directory for the project and set your path accordingly. Then download and install Grafana into your $GOPATH directory
|
||||
|
||||
@@ -1,7 +1,8 @@
|
||||
+++
|
||||
++
|
||||
title = "Project"
|
||||
type = "docs"
|
||||
identifier = "project"
|
||||
weight = 6
|
||||
+++
|
||||
|
||||
# Welcome to the grafana project
|
||||
|
||||
@@ -13,42 +13,28 @@ weight = 2
|
||||
Annotations provide a way to mark points on the graph with rich events. When you hover over an annotation
|
||||
you can get title, tags, and text information for the event.
|
||||
|
||||

|
||||

|
||||
|
||||
To add an annotation query click dashboard settings icon in top menu and select `Annotations` from the
|
||||
dropdown. This will open the `Annotations` edit view. Click the `Add` tab to add a new annotation query.
|
||||
## Queries
|
||||
|
||||
> Note: Annotations apply to all graphs in a given dashboard, not on a per-panel basis.
|
||||
Annotatation events are fetched via annotation queries. To add a new annotation query to a dashboard
|
||||
open the dashboard settings menu, then select `Annotations`. This will open the dashboard annotations
|
||||
settings view. To create a new annotation query hit the `New` button.
|
||||
|
||||
## Graphite annotations
|
||||

|
||||
|
||||
Graphite supports two ways to query annotations.
|
||||
Specify a name for the annotation query. This name is given to the toggle (checkbox) that will allow
|
||||
you to enable/disable showing annotation events from this query. For example you might have two
|
||||
annotation queries named `Deploys` and `Outages`. The toggles will allow you to decide what annotations
|
||||
to show.
|
||||
|
||||
- A regular metric query, use the `Graphite target expression` text input for this
|
||||
- Graphite events query, use the `Graphite event tags` text input, specify an tag or wildcard (leave empty should also work)
|
||||
### Annotation query details
|
||||
|
||||
## Elasticsearch annotations
|
||||

|
||||
The annotation query options are different for each data source.
|
||||
|
||||
Grafana can query any Elasticsearch index for annotation events. The index name can be the name of an alias or an index wildcard pattern.
|
||||
You can leave the search query blank or specify a lucene query.
|
||||
- [Graphite annotation queries]({{< relref "features/datasources/graphite.md#annotations" >}})
|
||||
- [Elasticsearch annotation queries]({{< relref "features/datasources/elasticsearch.md#annotations" >}})
|
||||
- [InfluxDB annotation queries]({{< relref "features/datasources/influxdb.md#annotations" >}})
|
||||
- [Prometheus annotation queries]({{< relref "features/datasources/prometheus.md#annotations" >}})
|
||||
|
||||
If your elasticsearch document has a timestamp field other than `@timestamp` you will need to specify that. As well
|
||||
as the name for the fields that should be used for the annotation title, tags and text. Tags and text are optional.
|
||||
|
||||
> **Note** The annotation timestamp field in elasticsearch need to be in UTC format.
|
||||
|
||||
## InfluxDB Annotations
|
||||

|
||||
|
||||
For InfluxDB you need to enter a query like in the above screenshot. You need to have the ```where $timeFilter``` part.
|
||||
If you only select one column you will not need to enter anything in the column mapping fields.
|
||||
|
||||
## Prometheus Annotations
|
||||
|
||||

|
||||
|
||||
Prometheus supports two ways to query annotations.
|
||||
|
||||
- A regular metric query
|
||||
- A Prometheus query for pending and firing alerts (for details see [Inspecting alerts during runtime](https://prometheus.io/docs/alerting/rules/#inspecting-alerts-during-runtime))
|
||||
|
||||
@@ -33,7 +33,7 @@ To import a dashboard open dashboard search and then hit the import button.
|
||||
|
||||
<img src="/img/docs/v31/import_step1.png">
|
||||
|
||||
From here you can upload a dashboard json file, paste a [Grafana.net](https://grafana.net) dashboard
|
||||
From here you can upload a dashboard json file, paste a [Grafana.com](https://grafana.com) dashboard
|
||||
url or paste dashboard json text directly into the text area.
|
||||
|
||||
<img src="/img/docs/v31/import_step2.png">
|
||||
@@ -41,15 +41,15 @@ url or paste dashboard json text directly into the text area.
|
||||
In step 2 of the import process Grafana will let you change the name of the dashboard, pick what
|
||||
data source you want the dashboard to use and specify any metric prefixes (if the dashboard use any).
|
||||
|
||||
## Discover dashboards on Grafana.net
|
||||
## Discover dashboards on Grafana.com
|
||||
|
||||
Find dashboards for common server applications at [Grafana.net/dashboards](https://grafana.net/dashboards).
|
||||
Find dashboards for common server applications at [Grafana.com/dashboards](https://grafana.com/dashboards).
|
||||
|
||||
<img src="/img/docs/v31/gnet_dashboards_list.png">
|
||||
|
||||
## Import & Sharing with Grafana 2.x or 3.0
|
||||
|
||||
Dashboards on Grafana.net use a new feature in Grafana 3.1 that allows the import process
|
||||
Dashboards on Grafana.com use a new feature in Grafana 3.1 that allows the import process
|
||||
to update each panel so that they are using a data source of your choosing. If you are running a
|
||||
Grafana version older than 3.1 then you might need to do some manual steps either
|
||||
before or after import in order for the dashboard to work properly.
|
||||
@@ -99,10 +99,10 @@ These are then referenced in the dashboard panels like this:
|
||||
```
|
||||
|
||||
These inputs and their usage in data source properties are automatically added during export in Grafana 3.1.
|
||||
If you run an older version of Grafana and want to share a dashboard on Grafana.net you need to manually
|
||||
If you run an older version of Grafana and want to share a dashboard on Grafana.com you need to manually
|
||||
add the inputs and templatize the datasource properties like above.
|
||||
|
||||
If you want to import a dashboard from Grafana.net into an older version of Grafana then you can either import
|
||||
If you want to import a dashboard from Grafana.com into an older version of Grafana then you can either import
|
||||
it as usual and then update the data source option in the metrics tab so that the panel is using the correct
|
||||
data source. Another alternative is to open the json file in a a text editor and update the data source properties
|
||||
to value that matches a name of your data source.
|
||||
|
||||
@@ -1,7 +1,7 @@
|
||||
+++
|
||||
title = "reference"
|
||||
type = "docs"
|
||||
identifier = "reference"
|
||||
weight = 6
|
||||
+++
|
||||
---
|
||||
title: Reference Index
|
||||
description: Grafana docs reference
|
||||
type: docs
|
||||
---
|
||||
|
||||
# Documentation
|
||||
|
||||
@@ -22,7 +22,7 @@ A dashboard snapshot is an instant way to share an interactive dashboard publicl
|
||||
(metric, template and annotation) and panel links, leaving only the visible metric data and series names embedded into your dashboard. Dashboard
|
||||
snapshots can be accessed by anyone who has the link and can reach the URL.
|
||||
|
||||

|
||||

|
||||
|
||||
### Publish snapshots
|
||||
You can publish snapshots to you local instance or to [snapshot.raintank.io](http://snapshot.raintank.io). The later is a free service
|
||||
@@ -42,8 +42,8 @@ You can embed a panel using an iframe on another web site. This tab will show yo
|
||||
Example:
|
||||
|
||||
```html
|
||||
<iframe src="http://snapshot.raintank.io/dashboard/solo/snapshot/UtvRYDv650fHOV2jV5QlAQhLnNOhB5ZN?panelId=4&fullscreen&from=1427385145990&to=1427388745990" width="650" height="300" frameborder="0"></iframe>
|
||||
<iframe src="https://snapshot.raintank.io/dashboard-solo/snapshot/y7zwi2bZ7FcoTlB93WN7yWO4aMiz3pZb?from=1493369923321&to=1493377123321&panelId=4" width="650" height="300" frameborder="0"></iframe>
|
||||
```
|
||||
|
||||
Below there should be an interactive Grafana graph embedded in an iframe:
|
||||
<iframe src="https://snapshot.raintank.io/dashboard-solo/snapshot/4IKyWYNEQll1B9FXcN3RIgx4M2VGgU8d?panelId=4&fullscreen" width="650" height="300" frameborder="0"></iframe>
|
||||
<iframe src="https://snapshot.raintank.io/dashboard-solo/snapshot/y7zwi2bZ7FcoTlB93WN7yWO4aMiz3pZb?from=1493369923321&to=1493377123321&panelId=4" width="650" height="300" frameborder="0"></iframe>
|
||||
|
||||
@@ -10,76 +10,162 @@ weight = 1
|
||||
|
||||
# Templating
|
||||
|
||||
<img class="no-shadow" src="/img/docs/v2/templating_var_list.png">
|
||||
Templating allows for more interactive and dynamic dashboards. Instead of hard-coding things like server, application
|
||||
and sensor name in you metric queries you can use variables in their place. Variables are shown as dropdown select boxes at the top of
|
||||
the dashboard. These dropdowns make it easy to change the data being displayed in your dashboard.
|
||||
|
||||
Dashboard Templating allows you to make your Dashboards more interactive and dynamic.
|
||||
<img class="no-shadow" src="/img/docs/v4/templated_dash.png">
|
||||
|
||||
They’re one of the most powerful and most used features of Grafana, and they’ve recently gotten even more attention in Grafana 2.0 and Grafana 2.1.
|
||||
## What is a variable?
|
||||
|
||||
You can create Dashboard Template variables that can be used practically anywhere in a Dashboard: data queries on individual Panels (within the Query Editor), the names in your legends, or titles in Panels and Rows.
|
||||
A variable is a placeholder for a value. You can use variables in metric queries and in panel titles. So when you change
|
||||
the value, using the dropdown at the top of the dashboard, your panel's metric queries will change to reflect the new value.
|
||||
|
||||
You can configure Dashboard Templating by clicking the dropdown cog on the top of the Dashboard while viewing it.
|
||||
### Interpolation
|
||||
|
||||
Panel titles and metric queries can refer to variables using two different syntaxes:
|
||||
|
||||
- `$<varname>` Example: apps.frontend.$server.requests.count
|
||||
- `[[varname]]` Example: apps.frontend.[[server]].requests.count
|
||||
|
||||
Why two ways? The first syntax is easier to read and write but does not allow you to use a variable in the middle of word. Use
|
||||
the second syntax in expressions like `my.server[[serverNumber]].count`.
|
||||
|
||||
Before queries are sent to your data source the query is **interpolated**, meaning the variable is replaced with its current value. During
|
||||
interpolation the variable value might be **escaped** in order to conform to the syntax of the query language and where it is used.
|
||||
For example, a variable used in a regex expression in an InfluxDB or Prometheus query will be regex escaped. Read the data source specific
|
||||
documentation article for details on value escaping during interpolation.
|
||||
|
||||
### Variable options
|
||||
|
||||
A variable is presented as a dropdown select box at the top of the dashboard. It has a current value and a set of **options**. The **options**
|
||||
is the set of values you can choose from.
|
||||
|
||||
## Adding a variable
|
||||
|
||||
<img class="no-shadow" src="/img/docs/v4/templating_var_list.png">
|
||||
|
||||
You add variables via Dashboard cogs menu > Templating. This opens up a list of variables and a `New` button to create a new variable.
|
||||
|
||||
### Basic variable options
|
||||
|
||||
Option | Description
|
||||
------- | --------
|
||||
*Name* | The name of the variable, this is the name you use when you refer to your variable in your metric queries. Must be unique and contain no white-spaces.
|
||||
*Label* | The name of the dropdown for this variable.
|
||||
*Hide* | Options to hide the dropdown select box.
|
||||
*Type* | Defines the variable type.
|
||||
|
||||
|
||||
## Variable types
|
||||
### Variable types
|
||||
|
||||
There are three different types of Template variables: query, custom, and interval.
|
||||
Type | Description
|
||||
------- | --------
|
||||
*Query* | This variable type allows you to write a data source query that usually returns a list of metric names, tag values or keys. For example, a query that returns a list of server names, sensor ids or data centers.
|
||||
*Interval* | This variable can represent time spans. Instead of hard-coding a group by time or date histogram interval, use a variable of this type.
|
||||
*Datasource* | This type allows you to quickly change the data source for an entire Dashboard. Useful if you have multiple instances of a data source in for example different environments.
|
||||
*Custom* | Define the variable options manually using a comma separated list.
|
||||
*Constant* | Define a hidden constant. Useful for metric path prefixes for dashboards you want to share. During dashboard export, constant variables will be made into an import option.
|
||||
*Ad hoc filters* | Very special kind of variable that only works with some data sources, InfluxDB & Elasticsearch currently. It allows you to add key/value filters that will automatically be added to all metric queries that use the specified data source.
|
||||
|
||||
They can all be used to create dynamic variables that you can use throughout the Dashboard, but they differ in how they get the data for their values.
|
||||
### Query options
|
||||
|
||||
This variable type is the most powerful and complex as it can dynamically fetch its options using a data source query.
|
||||
|
||||
### Query
|
||||
Option | Description
|
||||
------- | --------
|
||||
*Data source* | The data source target for the query.
|
||||
*Refresh* | Controls when to update the variable option list (values in the dropdown). **On Dashboard Load** will slow down dashboard load as the variable query needs to be completed before dashboard can be initialized. Set this only to **On Time Range Change** if your variable options query contains a time range filter or is dependent on dashboard time range.
|
||||
*Query* | The data source specific query expression.
|
||||
*Regex* | Regex to filter or capture specific parts of the names return by your data source query. Optional.
|
||||
*Sort* | Define sort order for options in dropdown. **Disabled** means that the order of options returned by your data source query will be used.
|
||||
|
||||
> Note: The Query type is Data Source specific. Please consult the appropriate documentation for your particular Data Source.
|
||||
### Query expressions
|
||||
|
||||
Query is the most common type of Template variable. Use the `Query` template type to generate a dynamic list of variables, simply by allowing Grafana to explore your Data Source metric namespace when the Dashboard loads.
|
||||
The query expressions are different for each data source.
|
||||
|
||||
For example a query like `prod.servers.*` will fill the variable with all possible values that exists in that wildcard position (in the case of the Graphite Data Source).
|
||||
- [Graphite templating queries]({{< relref "features/datasources/graphite.md#templating" >}})
|
||||
- [Elasticsearch templating queries]({{< relref "features/datasources/elasticsearch.md#templating" >}})
|
||||
- [InfluxDB templating queries]({{< relref "features/datasources/influxdb.md#templating" >}})
|
||||
- [Prometheus templating queries]({{< relref "features/datasources/prometheus.md#templating" >}})
|
||||
- [OpenTSDB templating queries]({{< relref "features/datasources/prometheus.md#templating" >}})
|
||||
|
||||
You can even create nested variables that use other variables in their definition. For example `apps.$app.servers.*` uses the variable $app in its own query definition.
|
||||
One thing to note is that query expressions can contain references to other variables and in effect create linked variables.
|
||||
Grafana will detect this and automatically refresh a variable when one of it's containing variables change.
|
||||
|
||||
You can utilize the special ** All ** value to allow the Dashboard user to query for every single Query variable returned. Grafana will automatically translate ** All ** into the appropriate format for your Data Source.
|
||||
## Selection Options
|
||||
|
||||
#### Multi-select
|
||||
As of Grafana 2.1, it is now possible to select a subset of Query Template variables (previously it was possible to select an individual value or 'All', not multiple values that were less than All). This is accomplished via the Multi-Select option. If enabled, the Dashboard user will be able to enable and disable individual variables.
|
||||
Option | Description
|
||||
------- | --------
|
||||
*Mulit-value* | If enabled, the variable will support the selection of multiple options at the same time.
|
||||
*Include All option* | Add a special `All` option whose value includes all options.
|
||||
*Custom all value* | By default the `All` value will include all options in combined expression. This can become very long and can have performance problems. Many times it can be better to specify a custom all value, like a wildcard regex. To make it possible to have custom regex, globs or lucene syntax in the **Custom all value** option it is never escaped so you will have to think avbout what is a valid value for your data source.
|
||||
|
||||
The Multi-Select functionality is taken a step further with the introduction of Multi-Select Tagging. This functionality allows you to group individual Template variables together under a Tag or Group name.
|
||||
### Formating multiple values
|
||||
|
||||
For example, if you were using Templating to list all 20 of your applications, you could use Multi-Select Tagging to group your applications by function or region or criticality, etc.
|
||||
Interpolating a variable with multiple values selected is tricky as it is not straight forward how to format the multiple values to into a string that
|
||||
is valid in the given context where the variable is used. Grafana tries to solve this by allowing each data source plugin to
|
||||
inform the templating interpolation engine what format to use for multiple values.
|
||||
|
||||
> Note: Multi-Select Tagging functionality is currently experimental but is part of Grafana 2.1. To enable this feature click the enable icon when editing Template options for a particular variable.
|
||||
**Graphite**, for example, uses glob expressions. A variable with multiple values would, in this case, be interpolated as `{host1,host2,host3}` if
|
||||
the current variable value was *host1*, *host2* and *host3*.
|
||||
|
||||
<img class="no-shadow" src="/img/docs/v2/template-tags-config.png">
|
||||
**InfluxDB and Prometheus** uses regex expressions, so the same variable
|
||||
would be interpolated as `(host1|host2|host3)`. Every value would also be regex escaped if not, a value with a regex control character would
|
||||
break the regex expression.
|
||||
|
||||
Grafana gets the list of tags and the list of values in each tag by performing two queries on your metric namespace.
|
||||
**Elasticsearch** uses lucene query syntax, so the same variable would, in this case, be formatted as `("host1" OR "host2" OR "host3")`. In this case every value
|
||||
needs to be escaped so that the value can contain lucene control words and quotation marks.
|
||||
|
||||
The Tags query returns a list of Tags.
|
||||
#### Formating troubles
|
||||
|
||||
The Tag values query returns the values for a given Tag.
|
||||
Automatic escaping & formatting can cause problems and it can be tricky to grasp the logic is behind it.
|
||||
Especially for InfluxDB and Prometheus where the use of regex syntax requires that the variable is used in regex operator context.
|
||||
If you do not want Grafana to do this automatic regex escaping and formatting your only option is to disable the *Multi-value* or *Include All option*
|
||||
options.
|
||||
|
||||
Note: a proof of concept shim that translates the metric query into a SQL call is provided. This allows you to maintain your tag:value mapping independently of your Data Source.
|
||||
### Value groups/tags
|
||||
|
||||
Once configured, Multi-Select Tagging provides a convenient way to group and your template variables, and slice your data in the exact way you want. The Tags can be seen on the right side of the template pull-down.
|
||||
If you have a lot of options in the dropdown for a multi-value variable. You can use this feature to group the values into selectable tags.
|
||||
|
||||

|
||||
Option | Description
|
||||
------- | --------
|
||||
*Tags query* | Data source query that should return a list of tags
|
||||
*Tag values query* | Data source query that should return a list of values for a specified tag key. Use `$tag` in the query to refer the currently selected tag.
|
||||
|
||||
### Interval
|
||||

|
||||
|
||||
Use the `Interval` type to create Template variables around time ranges (eg. `1m`,`1h`, `1d`). There is also a special `auto` option that will change depending on the current time range, you can specify how many times the current time range should be divided to calculate the current `auto` range.
|
||||
### Interval variables
|
||||
|
||||

|
||||
Use the `Interval` type to create a variable that represents a time span (eg. `1m`,`1h`, `1d`). There is also a special `auto` option that will change depending on the current time range. You can specify how many times the current time range should be divided to calculate the current `auto` timespan.
|
||||
|
||||
### Custom
|
||||
This variable type is useful as a parameter to group by time (for InfluxDB), Date histogram interval (for Elasticsearch) or as a *summarize* function parameter (for Graphite).
|
||||
|
||||
Use the `Custom` type to manually create Template variables around explicit values that are hard-coded into the Dashboard, and not dependent on any Data Source. You can specify multiple Custom Template values by separating them with a comma.
|
||||
## Repeating Panels
|
||||
|
||||
## Repeating Panels and Repeating Rows
|
||||
Template variables can be very useful to dynamically change your queries across a whole dashboard. If you want
|
||||
Grafana to dynamically create new panels or rows based on what values you have selected you can use the *Repeat* feature.
|
||||
|
||||
Template Variables can be very useful to dynamically change what you're visualizing on a given panel. Sometimes, you might want to create entire new Panels (or Rows) based on what Template Variables have been selected. This is now possible in Grafana 2.1.
|
||||
If you have a variable with `Multi-value` or `Include all value` options enabled you can choose one panel or one row and have Grafana repeat that row
|
||||
for every selected value. You find this option under the General tab in panel edit mode. Select the variable to repeat by, and a `min span`.
|
||||
The `min span` controls how small Grafana will make the panels (if you have many values selected). Grafana will automatically adjust the width of
|
||||
each repeated panel so that the whole row is filled. Currently, you cannot mix other panels on a row with a repeated panel.
|
||||
|
||||
Once you've got your Template variables (of any type) configured the way you'd like, check out the Repeating Panels and Repeating Row documentation
|
||||
Only make changes to the first panel (the original template). To have the changes take effect on all panels you need to trigger a dynamic dashboard re-build.
|
||||
You can do this by either changing the variable value (that is the basis for the repeat) or reload the dashboard.
|
||||
|
||||
## Screencast - Templated Graphite Queries
|
||||
## Repeating Rows
|
||||
|
||||
<iframe width="561" height="315" src="//www.youtube.com/embed/FhNUrueWwOk?list=PLDGkOdUX1Ujo3wHw9-z5Vo12YLqXRjzg2" frameborder="0" allowfullscreen></iframe>
|
||||
This option requires you to open the row options view. Hover over the row left side to trigger the row menu, in this menu click `Row Options`. This
|
||||
opens the row options view. Here you find a *Repeat* dropdown where you can select the variable to repeat by.
|
||||
|
||||
### URL state
|
||||
|
||||
Variable values are always synced to the URL using the syntax `var-<varname>=value`.
|
||||
|
||||
### Examples
|
||||
|
||||
- [Graphite Templated Dashboard](http://play.grafana.org/dashboard/db/graphite-templated-nested)
|
||||
- [Elasticsearch Templated Dashboard](http://play.grafana.org/dashboard/db/elasticsearch-templated)
|
||||
- [InfluxDB Templated Dashboard](http://play.grafana.org/dashboard/db/influxdb-templated-queries)
|
||||
|
||||
|
||||
@@ -9,58 +9,116 @@ weight = 10
|
||||
|
||||
# Screencasts
|
||||
|
||||
|
||||
{{< screencast src="https://www.youtube.com/embed/sKNZMtoSHN4?list=PLDGkOdUX1Ujo3wHw9-z5Vo12YLqXRjzg2" >}}
|
||||
|
||||
### Episode 7 - Beginners guide to building dashboards
|
||||
|
||||
For newer users of Grafana, this screencast will familiarize you with the general UI and teach you how to build your first Dashboard.
|
||||
|
||||
<div class="clearfix"></div>
|
||||
|
||||
{{< screencast src="https://www.youtube.com/embed/9ZCMVNxUf6s?list=PLDGkOdUX1Ujo3wHw9-z5Vo12YLqXRjzg2" >}}
|
||||
|
||||
### Episode 6 - Adding data sources, users & organizations
|
||||
|
||||
Now that Grafana has been installed, learn about adding data sources and get a closer look at adding and managing Users and Organizations.
|
||||
|
||||
<div class="clearfix"></div>
|
||||
|
||||
{{< screencast src="https://www.youtube.com/embed/E-gMFv85FE8?list=PLDGkOdUX1Ujo3wHw9-z5Vo12YLqXRjzg2" >}}
|
||||
|
||||
### Episode 5 - Installation & Configuration on Red Hat / CentOS
|
||||
|
||||
This screencasts shows how to get Grafana 2.0 installed and configured quickly on RPM-based Linux operating systems.
|
||||
|
||||
<div class="clearfix"></div>
|
||||
{{< screencast src="https://www.youtube.com/embed/JY22EBOR9hQ?list=PLDGkOdUX1Ujo3wHw9-z5Vo12YLqXRjzg2" >}}
|
||||
|
||||
### Episode 4 - Installation & Configuration on Ubuntu / Debian
|
||||
|
||||
Learn how to easily install the dependencies and packages to get Grafana 2.0 up and running on Ubuntu or Debian in just a few minutes.
|
||||
|
||||
<div class="clearfix"></div>
|
||||
|
||||
{{< screencast src="https://www.youtube.com/embed/FC13uhFRsVw?list=PLDGkOdUX1Ujo3wHw9-z5Vo12YLqXRjzg2" >}}
|
||||
|
||||
### Episode 3 - Whats New In Grafana 2.0
|
||||
|
||||
This screencast highlights many of the great new features that were included in the Grafana 2.0 release.
|
||||
|
||||
<div class="clearfix"></div>
|
||||
|
||||
{{< screencast src="//www.youtube.com/embed/FhNUrueWwOk?list=PLDGkOdUX1Ujo3wHw9-z5Vo12YLqXRjzg2" >}}
|
||||
### Episode 2 - Templated Graphite Queries
|
||||
|
||||
The screencast focuses on Templating with the Graphite Data Source. Learn how to make dynamic and adaptable Dashboards for your Graphite metrics.
|
||||
|
||||
<div class="clearfix"></div>
|
||||
|
||||
{{< screencast src="//www.youtube.com/embed/mgcJPREl3CU?list=PLDGkOdUX1Ujo3wHw9-z5Vo12YLqXRjzg2" >}}
|
||||
### Episode 1 - Building Graphite Queries
|
||||
|
||||
Learn how the Graphite Query Editor works, and how to use different graphing functions. There's also an introduction to graph display settings.
|
||||
|
||||
<div class="clearfix"></div>
|
||||
|
||||
<div class="video-card-container">
|
||||
<figure class="video-card">
|
||||
<a href="https://youtu.be/iUj6DwfBh88?list=PLDGkOdUX1Ujo3wHw9-z5Vo12YLqXRjzg2" target="_blank" rel="noopener noreferrer">
|
||||
<img src="/img/docs/v4/screencast_generic.png">
|
||||
<i class="fa fa-play"></i>
|
||||
</a>
|
||||
<figcaption>
|
||||
<a href="https://youtu.be/iUj6DwfBh88?list=PLDGkOdUX1Ujo3wHw9-z5Vo12YLqXRjzg2" target="_blank" rel="noopener noreferrer">
|
||||
#10 Dashboard Discovery & Sharing
|
||||
</a>
|
||||
</figcaption>
|
||||
</figure>
|
||||
<figure class="video-card">
|
||||
<a href="https://youtu.be/d6KicssNzxM?list=PLDGkOdUX1Ujo3wHw9-z5Vo12YLqXRjzg2" target="_blank" rel="noopener noreferrer">
|
||||
<img src="/img/docs/v4/screencast_generic.png">
|
||||
<i class="fa fa-play"></i>
|
||||
</a>
|
||||
<figcaption>
|
||||
<a href="https://youtu.be/d6KicssNzxM?list=PLDGkOdUX1Ujo3wHw9-z5Vo12YLqXRjzg2" target="_blank" rel="noopener noreferrer">
|
||||
#9 Using Elasticsearch in Grafana
|
||||
</a>
|
||||
</figcaption>
|
||||
</figure>
|
||||
<figure class="video-card">
|
||||
<a href="https://youtu.be/1kJyQKgk_oY?list=PLDGkOdUX1Ujo3wHw9-z5Vo12YLqXRjzg2" target="_blank" rel="noopener noreferrer">
|
||||
<img src="/img/docs/v4/screencast_generic.png">
|
||||
<i class="fa fa-play"></i>
|
||||
</a>
|
||||
<figcaption>
|
||||
<a href="https://youtu.be/1kJyQKgk_oY?list=PLDGkOdUX1Ujo3wHw9-z5Vo12YLqXRjzg2" target="_blank" rel="noopener noreferrer">
|
||||
#8 What's new in Grafana 3.0
|
||||
</a>
|
||||
</figcaption>
|
||||
</figure>
|
||||
<figure class="video-card">
|
||||
<a href="https://youtu.be/sKNZMtoSHN4?list=PLDGkOdUX1Ujo3wHw9-z5Vo12YLqXRjzg2" target="_blank" rel="noopener noreferrer">
|
||||
<img src="/img/docs/v4/screencast_generic.png">
|
||||
<i class="fa fa-play"></i>
|
||||
</a>
|
||||
<figcaption>
|
||||
<a href="https://youtu.be/sKNZMtoSHN4?list=PLDGkOdUX1Ujo3wHw9-z5Vo12YLqXRjzg2" target="_blank" rel="noopener noreferrer">
|
||||
#7 Beginners guide to building dashboards
|
||||
</a>
|
||||
</figcaption>
|
||||
</figure>
|
||||
<figure class="video-card">
|
||||
<a href="https://youtu.be/9ZCMVNxUf6s?list=PLDGkOdUX1Ujo3wHw9-z5Vo12YLqXRjzg2" target="_blank" rel="noopener noreferrer">
|
||||
<img src="/img/docs/v4/screencast_generic.png">
|
||||
<i class="fa fa-play"></i>
|
||||
</a>
|
||||
<figcaption>
|
||||
<a href="https://youtu.be/9ZCMVNxUf6s?list=PLDGkOdUX1Ujo3wHw9-z5Vo12YLqXRjzg2" target="_blank" rel="noopener noreferrer">
|
||||
#6 Adding data sources, users & orgs.
|
||||
</a>
|
||||
</figcaption>
|
||||
</figure>
|
||||
<figure class="video-card">
|
||||
<a href="https://youtu.be/E-gMFv84FE8?list=PLDGkOdUX1Ujo3wHw9-z5Vo12YLqXRjzg2" target="_blank" rel="noopener noreferrer">
|
||||
<img src="/img/docs/v4/screencast_generic.png">
|
||||
<i class="fa fa-play"></i>
|
||||
</a>
|
||||
<figcaption>
|
||||
<a href="https://youtu.be/E-gMFv84FE8?list=PLDGkOdUX1Ujo3wHw9-z5Vo12YLqXRjzg2" target="_blank" rel="noopener noreferrer">
|
||||
#5 Install & Setup on Redhat / Centos
|
||||
</a>
|
||||
</figcaption>
|
||||
</figure>
|
||||
<figure class="video-card">
|
||||
<a href="https://youtu.be/JY22EBOR9hQ?list=PLDGkOdUX1Ujo3wHw9-z5Vo12YLqXRjzg2" target="_blank" rel="noopener noreferrer">
|
||||
<img src="/img/docs/v4/screencast_generic.png">
|
||||
<i class="fa fa-play"></i>
|
||||
</a>
|
||||
<figcaption>
|
||||
<a href="https://youtu.be/JY22EBOR9hQ?list=PLDGkOdUX1Ujo3wHw9-z5Vo12YLqXRjzg2" target="_blank" rel="noopener noreferrer">
|
||||
#4 Install & Setup on Ubuntu / Debian
|
||||
</a>
|
||||
</figcaption>
|
||||
</figure>
|
||||
<figure class="video-card">
|
||||
<a href="https://youtu.be/FC13uhFRsVw?list=PLDGkOdUX1Ujo3wHw9-z5Vo12YLqXRjzg2" target="_blank" rel="noopener noreferrer">
|
||||
<img src="/img/docs/v4/screencast_generic.png">
|
||||
<i class="fa fa-play"></i>
|
||||
</a>
|
||||
<figcaption>
|
||||
<a href="https://youtu.be/FC13uhFRsVw?list=PLDGkOdUX1Ujo3wHw9-z5Vo12YLqXRjzg2" target="_blank" rel="noopener noreferrer">
|
||||
#3 Whats New In Grafana 2.0
|
||||
</a>
|
||||
</figcaption>
|
||||
</figure>
|
||||
<figure class="video-card">
|
||||
<a href="https://youtu.be/FhNUrueWwOk?list=PLDGkOdUX1Ujo3wHw9-z5Vo12YLqXRjzg2" target="_blank" rel="noopener noreferrer">
|
||||
<img src="/img/docs/v4/screencast_generic.png">
|
||||
<i class="fa fa-play"></i>
|
||||
</a>
|
||||
<figcaption>
|
||||
<a href="https://youtu.be/FhNUrueWwOk?list=PLDGkOdUX1Ujo3wHw9-z5Vo12YLqXRjzg2" target="_blank" rel="noopener noreferrer">
|
||||
#2 Templated Graphite Queries
|
||||
</a>
|
||||
</figcaption>
|
||||
</figure>
|
||||
<figure class="video-card">
|
||||
<a href="https://youtu.be/mgcJPREl3CU?list=PLDGkOdUX1Ujo3wHw9-z5Vo12YLqXRjzg2" target="_blank" rel="noopener noreferrer">
|
||||
<img src="/img/docs/v4/screencast_generic.png">
|
||||
<i class="fa fa-play"></i>
|
||||
</a>
|
||||
<figcaption>
|
||||
<a href="https://youtu.be/mgcJPREl3CU?list=PLDGkOdUX1Ujo3wHw9-z5Vo12YLqXRjzg2" target="_blank" rel="noopener noreferrer">
|
||||
#1 Building Graphite Queries
|
||||
</a>
|
||||
</figcaption>
|
||||
</figure>
|
||||
</div>
|
||||
|
||||
|
||||
@@ -94,8 +94,7 @@ td[class="stack-column-center"] {
|
||||
<table class="body" style="background: #2e2e2e;">
|
||||
<tr>
|
||||
<td class="center" align="center" valign="top">
|
||||
<center>
|
||||
|
||||
<center>
|
||||
<table class="row header">
|
||||
<tr>
|
||||
<td class="center" align="center">
|
||||
@@ -107,11 +106,11 @@ td[class="stack-column-center"] {
|
||||
|
||||
<table class="twelve columns">
|
||||
<tr>
|
||||
<td class="six sub-columns center">
|
||||
<img class="logo" src="http://grafana.org/assets/img/logo_new_transparent_200x48.png" style="width: 200px; float: none; display: inline">
|
||||
</td>
|
||||
<td class="expander"></td>
|
||||
</tr>
|
||||
<td class="twelve sub-columns center">
|
||||
<img class="logo" src="http://grafana.org/assets/img/logo_new_transparent_200x48.png" style="width: 200px; float: none; display: inline">
|
||||
</td>
|
||||
<td class="expander"></td>
|
||||
</tr>
|
||||
</table>
|
||||
|
||||
</td>
|
||||
|
||||
+2
-2
@@ -1,4 +1,4 @@
|
||||
{
|
||||
"stable": "4.1.1",
|
||||
"testing": "4.1.1"
|
||||
"stable": "4.2.0",
|
||||
"testing": "4.2.0"
|
||||
}
|
||||
|
||||
+3
-3
@@ -4,7 +4,7 @@
|
||||
"company": "Coding Instinct AB"
|
||||
},
|
||||
"name": "grafana",
|
||||
"version": "4.2.0",
|
||||
"version": "4.3.0-beta1",
|
||||
"repository": {
|
||||
"type": "git",
|
||||
"url": "http://github.com/grafana/grafana.git"
|
||||
@@ -76,8 +76,8 @@
|
||||
"systemjs-builder": "^0.15.34",
|
||||
"tether": "^1.4.0",
|
||||
"tether-drop": "https://github.com/torkelo/drop",
|
||||
"tslint": "^4.0.2",
|
||||
"typescript": "^2.1.4",
|
||||
"tslint": "^5.1.0",
|
||||
"typescript": "^2.2.2",
|
||||
"virtual-scroll": "^1.1.1"
|
||||
}
|
||||
}
|
||||
|
||||
@@ -37,14 +37,8 @@ MAX_OPEN_FILES=10000
|
||||
PID_FILE=/var/run/$NAME.pid
|
||||
DAEMON=/usr/sbin/$NAME
|
||||
|
||||
|
||||
umask 0027
|
||||
|
||||
if [ `id -u` -ne 0 ]; then
|
||||
echo "You need root privileges to run this script"
|
||||
exit 4
|
||||
fi
|
||||
|
||||
if [ ! -x $DAEMON ]; then
|
||||
echo "Program not installed or not executable"
|
||||
exit 5
|
||||
@@ -63,9 +57,16 @@ fi
|
||||
|
||||
DAEMON_OPTS="--pidfile=${PID_FILE} --config=${CONF_FILE} cfg:default.paths.data=${DATA_DIR} cfg:default.paths.logs=${LOG_DIR} cfg:default.paths.plugins=${PLUGINS_DIR}"
|
||||
|
||||
function checkUser() {
|
||||
if [ `id -u` -ne 0 ]; then
|
||||
echo "You need root privileges to run this script"
|
||||
exit 4
|
||||
fi
|
||||
}
|
||||
|
||||
case "$1" in
|
||||
start)
|
||||
|
||||
checkUser
|
||||
log_daemon_msg "Starting $DESC"
|
||||
|
||||
pid=`pidofproc -p $PID_FILE grafana`
|
||||
@@ -112,6 +113,7 @@ case "$1" in
|
||||
log_end_msg $return
|
||||
;;
|
||||
stop)
|
||||
checkUser
|
||||
log_daemon_msg "Stopping $DESC"
|
||||
|
||||
if [ -f "$PID_FILE" ]; then
|
||||
|
||||
@@ -3,6 +3,7 @@ Description=Grafana instance
|
||||
Documentation=http://docs.grafana.org
|
||||
Wants=network-online.target
|
||||
After=network-online.target
|
||||
After=postgresql.service mariadb.service mysql.service
|
||||
|
||||
[Service]
|
||||
EnvironmentFile=/etc/default/grafana-server
|
||||
|
||||
@@ -1,19 +1,18 @@
|
||||
#! /usr/bin/env bash
|
||||
deb_ver=4.1.2-1486989747
|
||||
rpm_ver=4.1.2-1486989747
|
||||
version=4.2.0
|
||||
|
||||
wget https://grafanarel.s3.amazonaws.com/builds/grafana_${deb_ver}_amd64.deb
|
||||
wget https://s3-us-west-2.amazonaws.com/grafana-releases/release/grafana_${version}_amd64.deb
|
||||
|
||||
package_cloud push grafana/stable/debian/jessie grafana_${deb_ver}_amd64.deb
|
||||
package_cloud push grafana/stable/debian/wheezy grafana_${deb_ver}_amd64.deb
|
||||
package_cloud push grafana/stable/debian/jessie grafana_${version}_amd64.deb
|
||||
package_cloud push grafana/stable/debian/wheezy grafana_${version}_amd64.deb
|
||||
|
||||
package_cloud push grafana/testing/debian/jessie grafana_${deb_ver}_amd64.deb
|
||||
package_cloud push grafana/testing/debian/wheezy grafana_${deb_ver}_amd64.deb
|
||||
package_cloud push grafana/testing/debian/jessie grafana_${version}_amd64.deb
|
||||
package_cloud push grafana/testing/debian/wheezy grafana_${version}_amd64.deb
|
||||
|
||||
wget https://grafanarel.s3.amazonaws.com/builds/grafana-${rpm_ver}.x86_64.rpm
|
||||
wget https://s3-us-west-2.amazonaws.com/grafana-releases/release/grafana-${version}-1.x86_64.rpm
|
||||
|
||||
package_cloud push grafana/testing/el/6 grafana-${rpm_ver}.x86_64.rpm
|
||||
package_cloud push grafana/testing/el/7 grafana-${rpm_ver}.x86_64.rpm
|
||||
package_cloud push grafana/testing/el/6 grafana-${version}-1.x86_64.rpm
|
||||
package_cloud push grafana/testing/el/7 grafana-${version}-1.x86_64.rpm
|
||||
|
||||
package_cloud push grafana/stable/el/7 grafana-${rpm_ver}.x86_64.rpm
|
||||
package_cloud push grafana/stable/el/6 grafana-${rpm_ver}.x86_64.rpm
|
||||
package_cloud push grafana/stable/el/7 grafana-${version}-1.x86_64.rpm
|
||||
package_cloud push grafana/stable/el/6 grafana-${version}-1.x86_64.rpm
|
||||
|
||||
@@ -36,11 +36,6 @@ MAX_OPEN_FILES=10000
|
||||
PID_FILE=/var/run/$NAME.pid
|
||||
DAEMON=/usr/sbin/$NAME
|
||||
|
||||
if [ `id -u` -ne 0 ]; then
|
||||
echo "You need root privileges to run this script"
|
||||
exit 4
|
||||
fi
|
||||
|
||||
if [ ! -x $DAEMON ]; then
|
||||
echo "Program not installed or not executable"
|
||||
exit 5
|
||||
@@ -70,8 +65,16 @@ function isRunning() {
|
||||
status -p $PID_FILE $NAME > /dev/null 2>&1
|
||||
}
|
||||
|
||||
function checkUser() {
|
||||
if [ `id -u` -ne 0 ]; then
|
||||
echo "You need root privileges to run this script"
|
||||
exit 4
|
||||
fi
|
||||
}
|
||||
|
||||
case "$1" in
|
||||
start)
|
||||
checkUser
|
||||
isRunning
|
||||
if [ $? -eq 0 ]; then
|
||||
echo "Already running."
|
||||
@@ -115,6 +118,7 @@ case "$1" in
|
||||
exit $return
|
||||
;;
|
||||
stop)
|
||||
checkUser
|
||||
echo -n "Stopping $DESC: ..."
|
||||
|
||||
if [ -f "$PID_FILE" ]; then
|
||||
|
||||
@@ -3,6 +3,7 @@ Description=Grafana instance
|
||||
Documentation=http://docs.grafana.org
|
||||
Wants=network-online.target
|
||||
After=network-online.target
|
||||
After=postgresql.service mariadb.service mysql.service
|
||||
|
||||
[Service]
|
||||
EnvironmentFile=/etc/sysconfig/grafana-server
|
||||
|
||||
@@ -255,6 +255,9 @@ func NotificationTest(c *middleware.Context, dto dtos.NotificationTestCommand) R
|
||||
}
|
||||
|
||||
if err := bus.Dispatch(cmd); err != nil {
|
||||
if err == models.ErrSmtpNotEnabled {
|
||||
return ApiError(412, err.Error(), err)
|
||||
}
|
||||
return ApiError(500, "Failed to send alert notifications", err)
|
||||
}
|
||||
|
||||
|
||||
@@ -39,12 +39,52 @@ func GetAnnotations(c *middleware.Context) Response {
|
||||
Text: item.Text,
|
||||
Metric: item.Metric,
|
||||
Title: item.Title,
|
||||
PanelId: item.PanelId,
|
||||
RegionId: item.RegionId,
|
||||
})
|
||||
}
|
||||
|
||||
return Json(200, result)
|
||||
}
|
||||
|
||||
func PostAnnotation(c *middleware.Context, cmd dtos.PostAnnotationsCmd) Response {
|
||||
repo := annotations.GetRepository()
|
||||
|
||||
item := annotations.Item{
|
||||
OrgId: c.OrgId,
|
||||
DashboardId: cmd.DashboardId,
|
||||
PanelId: cmd.PanelId,
|
||||
Epoch: cmd.Time / 1000,
|
||||
Title: cmd.Title,
|
||||
Text: cmd.Text,
|
||||
CategoryId: cmd.CategoryId,
|
||||
NewState: cmd.FillColor,
|
||||
Type: annotations.EventType,
|
||||
}
|
||||
|
||||
if err := repo.Save(&item); err != nil {
|
||||
return ApiError(500, "Failed to save annotation", err)
|
||||
}
|
||||
|
||||
// handle regions
|
||||
if cmd.IsRegion {
|
||||
item.RegionId = item.Id
|
||||
|
||||
if err := repo.Update(&item); err != nil {
|
||||
return ApiError(500, "Failed set regionId on annotation", err)
|
||||
}
|
||||
|
||||
item.Id = 0
|
||||
item.Epoch = cmd.TimeEnd
|
||||
|
||||
if err := repo.Save(&item); err != nil {
|
||||
return ApiError(500, "Failed save annotation for region end time", err)
|
||||
}
|
||||
}
|
||||
|
||||
return ApiSuccess("Annotation added")
|
||||
}
|
||||
|
||||
func DeleteAnnotations(c *middleware.Context, cmd dtos.DeleteAnnotationsCmd) Response {
|
||||
repo := annotations.GetRepository()
|
||||
|
||||
|
||||
+5
-1
@@ -252,6 +252,7 @@ func (hs *HttpServer) registerRoutes() {
|
||||
// metrics
|
||||
r.Post("/tsdb/query", bind(dtos.MetricRequest{}), wrap(QueryMetrics))
|
||||
r.Get("/tsdb/testdata/scenarios", wrap(GetTestDataScenarios))
|
||||
r.Get("/tsdb/testdata/gensql", reqGrafanaAdmin, wrap(GenerateSqlTestData))
|
||||
|
||||
// metrics
|
||||
r.Get("/metrics", wrap(GetInternalMetrics))
|
||||
@@ -276,7 +277,10 @@ func (hs *HttpServer) registerRoutes() {
|
||||
}, reqEditorRole)
|
||||
|
||||
r.Get("/annotations", wrap(GetAnnotations))
|
||||
r.Post("/annotations/mass-delete", reqOrgAdmin, bind(dtos.DeleteAnnotationsCmd{}), wrap(DeleteAnnotations))
|
||||
|
||||
r.Group("/annotations", func() {
|
||||
r.Post("/", bind(dtos.PostAnnotationsCmd{}), wrap(PostAnnotation))
|
||||
}, reqEditorRole)
|
||||
|
||||
// error test
|
||||
r.Get("/metrics/error", wrap(GenerateError))
|
||||
|
||||
@@ -3,7 +3,9 @@ package cloudwatch
|
||||
import (
|
||||
"encoding/json"
|
||||
"errors"
|
||||
"fmt"
|
||||
"io/ioutil"
|
||||
"os"
|
||||
"strings"
|
||||
"sync"
|
||||
"time"
|
||||
@@ -12,6 +14,7 @@ import (
|
||||
"github.com/aws/aws-sdk-go/aws/awsutil"
|
||||
"github.com/aws/aws-sdk-go/aws/credentials"
|
||||
"github.com/aws/aws-sdk-go/aws/credentials/ec2rolecreds"
|
||||
"github.com/aws/aws-sdk-go/aws/credentials/endpointcreds"
|
||||
"github.com/aws/aws-sdk-go/aws/ec2metadata"
|
||||
"github.com/aws/aws-sdk-go/aws/session"
|
||||
"github.com/aws/aws-sdk-go/service/cloudwatch"
|
||||
@@ -122,7 +125,7 @@ func getCredentials(dsInfo *datasourceInfo) (*credentials.Credentials, error) {
|
||||
[]credentials.Provider{
|
||||
&credentials.EnvProvider{},
|
||||
&credentials.SharedCredentialsProvider{Filename: "", Profile: dsInfo.Profile},
|
||||
&ec2rolecreds.EC2RoleProvider{Client: ec2metadata.New(stsSess), ExpiryWindow: 5 * time.Minute},
|
||||
remoteCredProvider(stsSess),
|
||||
})
|
||||
stsConfig := &aws.Config{
|
||||
Region: aws.String(dsInfo.Region),
|
||||
@@ -176,6 +179,30 @@ func getCredentials(dsInfo *datasourceInfo) (*credentials.Credentials, error) {
|
||||
return creds, nil
|
||||
}
|
||||
|
||||
func remoteCredProvider(sess *session.Session) credentials.Provider {
|
||||
ecsCredURI := os.Getenv("AWS_CONTAINER_CREDENTIALS_RELATIVE_URI")
|
||||
|
||||
if len(ecsCredURI) > 0 {
|
||||
return ecsCredProvider(sess, ecsCredURI)
|
||||
}
|
||||
return ec2RoleProvider(sess)
|
||||
}
|
||||
|
||||
func ecsCredProvider(sess *session.Session, uri string) credentials.Provider {
|
||||
const host = `169.254.170.2`
|
||||
|
||||
c := ec2metadata.New(sess)
|
||||
return endpointcreds.NewProviderClient(
|
||||
c.Client.Config,
|
||||
c.Client.Handlers,
|
||||
fmt.Sprintf("http://%s%s", host, uri),
|
||||
func(p *endpointcreds.Provider) { p.ExpiryWindow = 5 * time.Minute })
|
||||
}
|
||||
|
||||
func ec2RoleProvider(sess *session.Session) credentials.Provider {
|
||||
return &ec2rolecreds.EC2RoleProvider{Client: ec2metadata.New(sess), ExpiryWindow: 5 * time.Minute}
|
||||
}
|
||||
|
||||
func getAwsConfig(req *cwRequest) (*aws.Config, error) {
|
||||
creds, err := getCredentials(req.GetDatasourceInfo())
|
||||
if err != nil {
|
||||
|
||||
@@ -0,0 +1,43 @@
|
||||
package cloudwatch
|
||||
|
||||
import (
|
||||
"fmt"
|
||||
"os"
|
||||
"testing"
|
||||
|
||||
"github.com/aws/aws-sdk-go/aws/credentials/ec2rolecreds"
|
||||
"github.com/aws/aws-sdk-go/aws/credentials/endpointcreds"
|
||||
"github.com/aws/aws-sdk-go/aws/session"
|
||||
. "github.com/smartystreets/goconvey/convey"
|
||||
)
|
||||
|
||||
func TestECSCredProvider(t *testing.T) {
|
||||
Convey("Running in an ECS container task", t, func() {
|
||||
defer os.Clearenv()
|
||||
os.Setenv("AWS_CONTAINER_CREDENTIALS_RELATIVE_URI", "/abc/123")
|
||||
|
||||
sess, _ := session.NewSession()
|
||||
provider := remoteCredProvider(sess)
|
||||
|
||||
So(provider, ShouldNotBeNil)
|
||||
|
||||
ecsProvider, ok := provider.(*endpointcreds.Provider)
|
||||
So(ecsProvider, ShouldNotBeNil)
|
||||
So(ok, ShouldBeTrue)
|
||||
|
||||
So(ecsProvider.Client.Endpoint, ShouldEqual, fmt.Sprintf("http://169.254.170.2/abc/123"))
|
||||
})
|
||||
}
|
||||
|
||||
func TestDefaultEC2RoleProvider(t *testing.T) {
|
||||
Convey("Running outside an ECS container task", t, func() {
|
||||
sess, _ := session.NewSession()
|
||||
provider := remoteCredProvider(sess)
|
||||
|
||||
So(provider, ShouldNotBeNil)
|
||||
|
||||
ec2Provider, ok := provider.(*ec2rolecreds.EC2RoleProvider)
|
||||
So(ec2Provider, ShouldNotBeNil)
|
||||
So(ok, ShouldBeTrue)
|
||||
})
|
||||
}
|
||||
@@ -81,7 +81,7 @@ func init() {
|
||||
"AWS/Redshift": {"CPUUtilization", "DatabaseConnections", "HealthStatus", "MaintenanceMode", "NetworkReceiveThroughput", "NetworkTransmitThroughput", "PercentageDiskSpaceUsed", "ReadIOPS", "ReadLatency", "ReadThroughput", "WriteIOPS", "WriteLatency", "WriteThroughput"},
|
||||
"AWS/RDS": {"ActiveTransactions", "AuroraBinlogReplicaLag", "AuroraReplicaLag", "AuroraReplicaLagMaximum", "AuroraReplicaLagMinimum", "BinLogDiskUsage", "BlockedTransactions", "BufferCacheHitRatio", "CommitLatency", "CommitThroughput", "CPUCreditBalance", "CPUCreditUsage", "CPUUtilization", "DatabaseConnections", "DDLLatency", "DDLThroughput", "Deadlocks", "DiskQueueDepth", "DMLLatency", "DMLThroughput", "FailedSqlStatements", "FreeableMemory", "FreeStorageSpace", "LoginFailures", "NetworkReceiveThroughput", "NetworkTransmitThroughput", "ReadIOPS", "ReadLatency", "ReadThroughput", "ReplicaLag", "ResultSetCacheHitRatio", "SelectLatency", "SelectThroughput", "SwapUsage", "TotalConnections", "VolumeReadIOPS", "VolumeWriteIOPS", "WriteIOPS", "WriteLatency", "WriteThroughput"},
|
||||
"AWS/Route53": {"HealthCheckStatus", "HealthCheckPercentageHealthy", "ConnectionTime", "SSLHandshakeTime", "TimeToFirstByte"},
|
||||
"AWS/S3": {"BucketSizeBytes", "NumberOfObjects"},
|
||||
"AWS/S3": {"BucketSizeBytes", "NumberOfObjects", "AllRequests", "GetRequests", "PutRequests", "DeleteRequests", "HeadRequests", "PostRequests", "ListRequests", "BytesDownloaded", "BytesUploaded", "4xxErrors", "5xxErrors", "FirstByteLatency", "TotalRequestLatency"},
|
||||
"AWS/SES": {"Bounce", "Complaint", "Delivery", "Reject", "Send"},
|
||||
"AWS/SNS": {"NumberOfMessagesPublished", "PublishSize", "NumberOfNotificationsDelivered", "NumberOfNotificationsFailed"},
|
||||
"AWS/SQS": {"NumberOfMessagesSent", "SentMessageSize", "NumberOfMessagesReceived", "NumberOfEmptyReceives", "NumberOfMessagesDeleted", "ApproximateNumberOfMessagesDelayed", "ApproximateNumberOfMessagesVisible", "ApproximateNumberOfMessagesNotVisible"},
|
||||
@@ -123,7 +123,7 @@ func init() {
|
||||
"AWS/Redshift": {"NodeID", "ClusterIdentifier"},
|
||||
"AWS/RDS": {"DBInstanceIdentifier", "DBClusterIdentifier", "DatabaseClass", "EngineName"},
|
||||
"AWS/Route53": {"HealthCheckId"},
|
||||
"AWS/S3": {"BucketName", "StorageType"},
|
||||
"AWS/S3": {"BucketName", "StorageType", "FilterId"},
|
||||
"AWS/SES": {},
|
||||
"AWS/SNS": {"Application", "Platform", "TopicName"},
|
||||
"AWS/SQS": {"QueueName"},
|
||||
|
||||
+18
-10
@@ -86,11 +86,6 @@ func ProxyDataSourceRequest(c *middleware.Context) {
|
||||
return
|
||||
}
|
||||
|
||||
if ds.Type == m.DS_CLOUDWATCH {
|
||||
cloudwatch.HandleRequest(c, ds)
|
||||
return
|
||||
}
|
||||
|
||||
if ds.Type == m.DS_INFLUXDB {
|
||||
if c.Query("db") != ds.Database {
|
||||
c.JsonApiErr(403, "Datasource is not configured to allow this database", nil)
|
||||
@@ -98,12 +93,14 @@ func ProxyDataSourceRequest(c *middleware.Context) {
|
||||
}
|
||||
}
|
||||
|
||||
if ds.Type == m.DS_CLOUDWATCH {
|
||||
cloudwatch.HandleRequest(c, ds)
|
||||
return
|
||||
}
|
||||
|
||||
targetUrl, _ := url.Parse(ds.Url)
|
||||
if len(setting.DataProxyWhiteList) > 0 {
|
||||
if _, exists := setting.DataProxyWhiteList[targetUrl.Host]; !exists {
|
||||
c.JsonApiErr(403, "Data proxy hostname and ip are not included in whitelist", nil)
|
||||
return
|
||||
}
|
||||
if !checkWhiteList(c, targetUrl.Host) {
|
||||
return
|
||||
}
|
||||
|
||||
proxyPath := c.Params("*")
|
||||
@@ -165,3 +162,14 @@ func logProxyRequest(dataSourceType string, c *middleware.Context) {
|
||||
"method", c.Req.Request.Method,
|
||||
"body", body)
|
||||
}
|
||||
|
||||
func checkWhiteList(c *middleware.Context, host string) bool {
|
||||
if host != "" && len(setting.DataProxyWhiteList) > 0 {
|
||||
if _, exists := setting.DataProxyWhiteList[host]; !exists {
|
||||
c.JsonApiErr(403, "Data proxy hostname and ip are not included in whitelist", nil)
|
||||
return false
|
||||
}
|
||||
}
|
||||
|
||||
return true
|
||||
}
|
||||
|
||||
@@ -20,7 +20,7 @@ func GetDataSources(c *middleware.Context) Response {
|
||||
|
||||
result := make(dtos.DataSourceList, 0)
|
||||
for _, ds := range query.Result {
|
||||
dsItem := dtos.DataSource{
|
||||
dsItem := dtos.DataSourceListItemDTO{
|
||||
Id: ds.Id,
|
||||
OrgId: ds.OrgId,
|
||||
Name: ds.Name,
|
||||
@@ -149,8 +149,8 @@ func fillWithSecureJsonData(cmd *m.UpdateDataSourceCommand) error {
|
||||
if err != nil {
|
||||
return err
|
||||
}
|
||||
secureJsonData := ds.SecureJsonData.Decrypt()
|
||||
|
||||
secureJsonData := ds.SecureJsonData.Decrypt()
|
||||
for k, v := range secureJsonData {
|
||||
|
||||
if _, ok := cmd.SecureJsonData[k]; !ok {
|
||||
@@ -158,6 +158,8 @@ func fillWithSecureJsonData(cmd *m.UpdateDataSourceCommand) error {
|
||||
}
|
||||
}
|
||||
|
||||
// set version from db
|
||||
cmd.Version = ds.Version
|
||||
return nil
|
||||
}
|
||||
|
||||
|
||||
@@ -12,10 +12,24 @@ type Annotation struct {
|
||||
Title string `json:"title"`
|
||||
Text string `json:"text"`
|
||||
Metric string `json:"metric"`
|
||||
RegionId int64 `json:"regionId"`
|
||||
|
||||
Data *simplejson.Json `json:"data"`
|
||||
}
|
||||
|
||||
type PostAnnotationsCmd struct {
|
||||
DashboardId int64 `json:"dashboardId"`
|
||||
PanelId int64 `json:"panelId"`
|
||||
CategoryId int64 `json:"categoryId"`
|
||||
Time int64 `json:"time"`
|
||||
Title string `json:"title"`
|
||||
Text string `json:"text"`
|
||||
|
||||
FillColor string `json:"fillColor"`
|
||||
IsRegion bool `json:"isRegion"`
|
||||
TimeEnd int64 `json:"timeEnd"`
|
||||
}
|
||||
|
||||
type DeleteAnnotationsCmd struct {
|
||||
AlertId int64 `json:"alertId"`
|
||||
DashboardId int64 `json:"dashboardId"`
|
||||
|
||||
+17
-1
@@ -84,7 +84,23 @@ type DataSource struct {
|
||||
SecureJsonFields map[string]bool `json:"secureJsonFields"`
|
||||
}
|
||||
|
||||
type DataSourceList []DataSource
|
||||
type DataSourceListItemDTO struct {
|
||||
Id int64 `json:"id"`
|
||||
OrgId int64 `json:"orgId"`
|
||||
Name string `json:"name"`
|
||||
Type string `json:"type"`
|
||||
TypeLogoUrl string `json:"typeLogoUrl"`
|
||||
Access m.DsAccess `json:"access"`
|
||||
Url string `json:"url"`
|
||||
Password string `json:"password"`
|
||||
User string `json:"user"`
|
||||
Database string `json:"database"`
|
||||
BasicAuth bool `json:"basicAuth"`
|
||||
IsDefault bool `json:"isDefault"`
|
||||
JsonData *simplejson.Json `json:"jsonData,omitempty"`
|
||||
}
|
||||
|
||||
type DataSourceList []DataSourceListItemDTO
|
||||
|
||||
func (slice DataSourceList) Len() int {
|
||||
return len(slice)
|
||||
|
||||
@@ -21,6 +21,7 @@ type PluginSetting struct {
|
||||
|
||||
LatestVersion string `json:"latestVersion"`
|
||||
HasUpdate bool `json:"hasUpdate"`
|
||||
State string `json:"state"`
|
||||
}
|
||||
|
||||
type PluginListItem struct {
|
||||
@@ -33,6 +34,7 @@ type PluginListItem struct {
|
||||
LatestVersion string `json:"latestVersion"`
|
||||
HasUpdate bool `json:"hasUpdate"`
|
||||
DefaultNavUrl string `json:"defaultNavUrl"`
|
||||
State string `json:"state"`
|
||||
}
|
||||
|
||||
type PluginList []PluginListItem
|
||||
|
||||
+25
-24
@@ -42,6 +42,7 @@ func getFrontendSettingsMap(c *middleware.Context) (map[string]interface{}, erro
|
||||
}
|
||||
|
||||
var dsMap = map[string]interface{}{
|
||||
"id": ds.Id,
|
||||
"type": ds.Type,
|
||||
"name": ds.Name,
|
||||
"url": url,
|
||||
@@ -101,18 +102,15 @@ func getFrontendSettingsMap(c *middleware.Context) (map[string]interface{}, erro
|
||||
datasources[ds.Name] = dsMap
|
||||
}
|
||||
|
||||
// add grafana backend data source
|
||||
grafanaDatasourceMeta, _ := plugins.DataSources["grafana"]
|
||||
datasources["-- Grafana --"] = map[string]interface{}{
|
||||
"type": "grafana",
|
||||
"name": "-- Grafana --",
|
||||
"meta": grafanaDatasourceMeta,
|
||||
}
|
||||
|
||||
// add mixed backend data source
|
||||
datasources["-- Mixed --"] = map[string]interface{}{
|
||||
"type": "mixed",
|
||||
"meta": plugins.DataSources["mixed"],
|
||||
// add datasources that are built in (meaning they are not added via data sources page, nor have any entry in datasource table)
|
||||
for _, ds := range plugins.DataSources {
|
||||
if ds.BuiltIn {
|
||||
datasources[ds.Name] = map[string]interface{}{
|
||||
"type": ds.Type,
|
||||
"name": ds.Name,
|
||||
"meta": plugins.DataSources[ds.Id],
|
||||
}
|
||||
}
|
||||
}
|
||||
|
||||
if defaultDatasource == "" {
|
||||
@@ -133,16 +131,17 @@ func getFrontendSettingsMap(c *middleware.Context) (map[string]interface{}, erro
|
||||
}
|
||||
|
||||
jsonObj := map[string]interface{}{
|
||||
"defaultDatasource": defaultDatasource,
|
||||
"datasources": datasources,
|
||||
"panels": panels,
|
||||
"appSubUrl": setting.AppSubUrl,
|
||||
"allowOrgCreate": (setting.AllowUserOrgCreate && c.IsSignedIn) || c.IsGrafanaAdmin,
|
||||
"authProxyEnabled": setting.AuthProxyEnabled,
|
||||
"ldapEnabled": setting.LdapEnabled,
|
||||
"alertingEnabled": setting.AlertingEnabled,
|
||||
"googleAnalyticsId": setting.GoogleAnalyticsId,
|
||||
"disableLoginForm": setting.DisableLoginForm,
|
||||
"defaultDatasource": defaultDatasource,
|
||||
"datasources": datasources,
|
||||
"panels": panels,
|
||||
"appSubUrl": setting.AppSubUrl,
|
||||
"allowOrgCreate": (setting.AllowUserOrgCreate && c.IsSignedIn) || c.IsGrafanaAdmin,
|
||||
"authProxyEnabled": setting.AuthProxyEnabled,
|
||||
"ldapEnabled": setting.LdapEnabled,
|
||||
"alertingEnabled": setting.AlertingEnabled,
|
||||
"googleAnalyticsId": setting.GoogleAnalyticsId,
|
||||
"disableLoginForm": setting.DisableLoginForm,
|
||||
"disableSignoutMenu": setting.DisableSignoutMenu,
|
||||
"buildInfo": map[string]interface{}{
|
||||
"version": setting.BuildVersion,
|
||||
"commit": setting.BuildCommit,
|
||||
@@ -167,10 +166,12 @@ func getPanelSort(id string) int {
|
||||
sort = 3
|
||||
case "text":
|
||||
sort = 4
|
||||
case "alertlist":
|
||||
case "heatmap":
|
||||
sort = 5
|
||||
case "dashlist":
|
||||
case "alertlist":
|
||||
sort = 6
|
||||
case "dashlist":
|
||||
sort = 7
|
||||
}
|
||||
return sort
|
||||
}
|
||||
|
||||
+41
-1
@@ -5,6 +5,7 @@ import (
|
||||
"crypto/tls"
|
||||
"errors"
|
||||
"fmt"
|
||||
"net"
|
||||
"net/http"
|
||||
"os"
|
||||
"path"
|
||||
@@ -13,9 +14,12 @@ import (
|
||||
|
||||
"github.com/grafana/grafana/pkg/api/live"
|
||||
httpstatic "github.com/grafana/grafana/pkg/api/static"
|
||||
"github.com/grafana/grafana/pkg/bus"
|
||||
"github.com/grafana/grafana/pkg/cmd/grafana-cli/logger"
|
||||
"github.com/grafana/grafana/pkg/components/simplejson"
|
||||
"github.com/grafana/grafana/pkg/log"
|
||||
"github.com/grafana/grafana/pkg/middleware"
|
||||
"github.com/grafana/grafana/pkg/models"
|
||||
"github.com/grafana/grafana/pkg/plugins"
|
||||
"github.com/grafana/grafana/pkg/setting"
|
||||
)
|
||||
@@ -46,7 +50,7 @@ func (hs *HttpServer) Start(ctx context.Context) error {
|
||||
hs.streamManager.Run(ctx)
|
||||
|
||||
listenAddr := fmt.Sprintf("%s:%s", setting.HttpAddr, setting.HttpPort)
|
||||
hs.log.Info("Initializing HTTP Server", "address", listenAddr, "protocol", setting.Protocol, "subUrl", setting.AppSubUrl)
|
||||
hs.log.Info("Initializing HTTP Server", "address", listenAddr, "protocol", setting.Protocol, "subUrl", setting.AppSubUrl, "socket", setting.SocketPath)
|
||||
|
||||
hs.httpSrv = &http.Server{Addr: listenAddr, Handler: hs.macaron}
|
||||
switch setting.Protocol {
|
||||
@@ -62,6 +66,18 @@ func (hs *HttpServer) Start(ctx context.Context) error {
|
||||
hs.log.Debug("server was shutdown gracefully")
|
||||
return nil
|
||||
}
|
||||
case setting.SOCKET:
|
||||
ln, err := net.Listen("unix", setting.SocketPath)
|
||||
if err != nil {
|
||||
hs.log.Debug("server was shutdown gracefully")
|
||||
return nil
|
||||
}
|
||||
|
||||
err = hs.httpSrv.Serve(ln)
|
||||
if err != nil {
|
||||
hs.log.Debug("server was shutdown gracefully")
|
||||
return nil
|
||||
}
|
||||
default:
|
||||
hs.log.Error("Invalid protocol", "protocol", setting.Protocol)
|
||||
err = errors.New("Invalid Protocol")
|
||||
@@ -147,6 +163,7 @@ func (hs *HttpServer) newMacaron() *macaron.Macaron {
|
||||
Delims: macaron.Delims{Left: "[[", Right: "]]"},
|
||||
}))
|
||||
|
||||
m.Use(hs.healthHandler)
|
||||
m.Use(middleware.GetContextHandler())
|
||||
m.Use(middleware.Sessioner(&setting.SessionOptions))
|
||||
m.Use(middleware.RequestMetrics())
|
||||
@@ -160,6 +177,29 @@ func (hs *HttpServer) newMacaron() *macaron.Macaron {
|
||||
return m
|
||||
}
|
||||
|
||||
func (hs *HttpServer) healthHandler(ctx *macaron.Context) {
|
||||
if ctx.Req.Method != "GET" || ctx.Req.URL.Path != "/api/health" {
|
||||
return
|
||||
}
|
||||
|
||||
data := simplejson.New()
|
||||
data.Set("database", "ok")
|
||||
data.Set("version", setting.BuildVersion)
|
||||
data.Set("commit", setting.BuildCommit)
|
||||
|
||||
if err := bus.Dispatch(&models.GetDBHealthQuery{}); err != nil {
|
||||
data.Set("database", "failing")
|
||||
ctx.Resp.Header().Set("Content-Type", "application/json; charset=UTF-8")
|
||||
ctx.Resp.WriteHeader(503)
|
||||
} else {
|
||||
ctx.Resp.Header().Set("Content-Type", "application/json; charset=UTF-8")
|
||||
ctx.Resp.WriteHeader(200)
|
||||
}
|
||||
|
||||
dataBytes, _ := data.EncodePretty()
|
||||
ctx.Resp.Write(dataBytes)
|
||||
}
|
||||
|
||||
func (hs *HttpServer) mapStatic(m *macaron.Macaron, rootDir string, dir string, prefix string) {
|
||||
headers := func(c *macaron.Context) {
|
||||
c.Resp.Header().Set("Cache-Control", "public, max-age=3600")
|
||||
|
||||
+7
-4
@@ -11,7 +11,6 @@ import (
|
||||
"github.com/grafana/grafana/pkg/middleware"
|
||||
m "github.com/grafana/grafana/pkg/models"
|
||||
"github.com/grafana/grafana/pkg/setting"
|
||||
"github.com/grafana/grafana/pkg/util"
|
||||
)
|
||||
|
||||
const (
|
||||
@@ -35,6 +34,11 @@ func LoginView(c *middleware.Context) {
|
||||
viewData.Settings["loginHint"] = setting.LoginHint
|
||||
viewData.Settings["disableLoginForm"] = setting.DisableLoginForm
|
||||
|
||||
if loginError, ok := c.Session.Get("loginError").(string); ok {
|
||||
c.Session.Delete("loginError")
|
||||
viewData.Settings["loginError"] = loginError
|
||||
}
|
||||
|
||||
if !tryLoginUsingRememberCookie(c) {
|
||||
c.HTML(200, VIEW_INDEX, viewData)
|
||||
return
|
||||
@@ -74,8 +78,7 @@ func tryLoginUsingRememberCookie(c *middleware.Context) bool {
|
||||
user := userQuery.Result
|
||||
|
||||
// validate remember me cookie
|
||||
if val, _ := c.GetSuperSecureCookie(
|
||||
util.EncodeMd5(user.Rands+user.Password), setting.CookieRememberName); val != user.Login {
|
||||
if val, _ := c.GetSuperSecureCookie(user.Rands+user.Password, setting.CookieRememberName); val != user.Login {
|
||||
return false
|
||||
}
|
||||
|
||||
@@ -137,7 +140,7 @@ func loginUserWithUser(user *m.User, c *middleware.Context) {
|
||||
days := 86400 * setting.LogInRememberDays
|
||||
if days > 0 {
|
||||
c.SetCookie(setting.CookieUserName, user.Login, days, setting.AppSubUrl+"/")
|
||||
c.SetSuperSecureCookie(util.EncodeMd5(user.Rands+user.Password), setting.CookieRememberName, user.Login, days, setting.AppSubUrl+"/")
|
||||
c.SetSuperSecureCookie(user.Rands+user.Password, setting.CookieRememberName, user.Login, days, setting.AppSubUrl+"/")
|
||||
}
|
||||
|
||||
c.Session.Set(middleware.SESS_KEY_USERID, user.Id)
|
||||
|
||||
+20
-10
@@ -23,6 +23,13 @@ import (
|
||||
"github.com/grafana/grafana/pkg/social"
|
||||
)
|
||||
|
||||
var (
|
||||
ErrProviderDeniedRequest = errors.New("Login provider denied login request")
|
||||
ErrEmailNotAllowed = errors.New("Required email domain not fulfilled")
|
||||
ErrSignUpNotAllowed = errors.New("Signup is not allowed for this adapter")
|
||||
ErrUsersQuotaReached = errors.New("Users quota reached")
|
||||
)
|
||||
|
||||
func GenStateString() string {
|
||||
rnd := make([]byte, 32)
|
||||
rand.Read(rnd)
|
||||
@@ -45,8 +52,7 @@ func OAuthLogin(ctx *middleware.Context) {
|
||||
error := ctx.Query("error")
|
||||
if error != "" {
|
||||
errorDesc := ctx.Query("error_description")
|
||||
ctx.Logger.Info("OAuthLogin Failed", "error", error, "errorDesc", errorDesc)
|
||||
ctx.Redirect(setting.AppSubUrl + "/login?failCode=1003")
|
||||
redirectWithError(ctx, ErrProviderDeniedRequest, "error", error, "errorDesc", errorDesc)
|
||||
return
|
||||
}
|
||||
|
||||
@@ -118,10 +124,8 @@ func OAuthLogin(ctx *middleware.Context) {
|
||||
// get user info
|
||||
userInfo, err := connect.UserInfo(client)
|
||||
if err != nil {
|
||||
if err == social.ErrMissingTeamMembership {
|
||||
ctx.Redirect(setting.AppSubUrl + "/login?failCode=1000")
|
||||
} else if err == social.ErrMissingOrganizationMembership {
|
||||
ctx.Redirect(setting.AppSubUrl + "/login?failCode=1001")
|
||||
if sErr, ok := err.(*social.Error); ok {
|
||||
redirectWithError(ctx, sErr)
|
||||
} else {
|
||||
ctx.Handle(500, fmt.Sprintf("login.OAuthLogin(get info from %s)", name), err)
|
||||
}
|
||||
@@ -132,8 +136,7 @@ func OAuthLogin(ctx *middleware.Context) {
|
||||
|
||||
// validate that the email is allowed to login to grafana
|
||||
if !connect.IsEmailAllowed(userInfo.Email) {
|
||||
ctx.Logger.Info("OAuth login attempt with unallowed email", "email", userInfo.Email)
|
||||
ctx.Redirect(setting.AppSubUrl + "/login?failCode=1002")
|
||||
redirectWithError(ctx, ErrEmailNotAllowed)
|
||||
return
|
||||
}
|
||||
|
||||
@@ -143,7 +146,7 @@ func OAuthLogin(ctx *middleware.Context) {
|
||||
// create account if missing
|
||||
if err == m.ErrUserNotFound {
|
||||
if !connect.IsSignupAllowed() {
|
||||
ctx.Redirect(setting.AppSubUrl + "/login")
|
||||
redirectWithError(ctx, ErrSignUpNotAllowed)
|
||||
return
|
||||
}
|
||||
limitReached, err := middleware.QuotaReached(ctx, "user")
|
||||
@@ -152,7 +155,7 @@ func OAuthLogin(ctx *middleware.Context) {
|
||||
return
|
||||
}
|
||||
if limitReached {
|
||||
ctx.Redirect(setting.AppSubUrl + "/login")
|
||||
redirectWithError(ctx, ErrUsersQuotaReached)
|
||||
return
|
||||
}
|
||||
cmd := m.CreateUserCommand{
|
||||
@@ -186,3 +189,10 @@ func OAuthLogin(ctx *middleware.Context) {
|
||||
|
||||
ctx.Redirect(setting.AppSubUrl + "/")
|
||||
}
|
||||
|
||||
func redirectWithError(ctx *middleware.Context, err error, v ...interface{}) {
|
||||
ctx.Logger.Info(err.Error(), v...)
|
||||
// TODO: we can use the flash storage here once it's implemented
|
||||
ctx.Session.Set("loginError", err.Error())
|
||||
ctx.Redirect(setting.AppSubUrl + "/login")
|
||||
}
|
||||
|
||||
+35
-5
@@ -6,6 +6,7 @@ import (
|
||||
"net/http"
|
||||
|
||||
"github.com/grafana/grafana/pkg/api/dtos"
|
||||
"github.com/grafana/grafana/pkg/bus"
|
||||
"github.com/grafana/grafana/pkg/metrics"
|
||||
"github.com/grafana/grafana/pkg/middleware"
|
||||
"github.com/grafana/grafana/pkg/models"
|
||||
@@ -18,6 +19,20 @@ import (
|
||||
func QueryMetrics(c *middleware.Context, reqDto dtos.MetricRequest) Response {
|
||||
timeRange := tsdb.NewTimeRange(reqDto.From, reqDto.To)
|
||||
|
||||
if len(reqDto.Queries) == 0 {
|
||||
return ApiError(400, "No queries found in query", nil)
|
||||
}
|
||||
|
||||
dsId, err := reqDto.Queries[0].Get("datasourceId").Int64()
|
||||
if err != nil {
|
||||
return ApiError(400, "Query missing datasourceId", nil)
|
||||
}
|
||||
|
||||
dsQuery := models.GetDataSourceByIdQuery{Id: dsId}
|
||||
if err := bus.Dispatch(&dsQuery); err != nil {
|
||||
return ApiError(500, "failed to fetch data source", err)
|
||||
}
|
||||
|
||||
request := &tsdb.Request{TimeRange: timeRange}
|
||||
|
||||
for _, query := range reqDto.Queries {
|
||||
@@ -26,10 +41,7 @@ func QueryMetrics(c *middleware.Context, reqDto dtos.MetricRequest) Response {
|
||||
MaxDataPoints: query.Get("maxDataPoints").MustInt64(100),
|
||||
IntervalMs: query.Get("intervalMs").MustInt64(1000),
|
||||
Model: query,
|
||||
DataSource: &models.DataSource{
|
||||
Name: "Grafana TestDataDB",
|
||||
Type: "grafana-testdata-datasource",
|
||||
},
|
||||
DataSource: dsQuery.Result,
|
||||
})
|
||||
}
|
||||
|
||||
@@ -38,7 +50,16 @@ func QueryMetrics(c *middleware.Context, reqDto dtos.MetricRequest) Response {
|
||||
return ApiError(500, "Metric request error", err)
|
||||
}
|
||||
|
||||
return Json(200, &resp)
|
||||
statusCode := 200
|
||||
for _, res := range resp.Results {
|
||||
if res.Error != nil {
|
||||
res.ErrorString = res.Error.Error()
|
||||
resp.Message = res.ErrorString
|
||||
statusCode = 500
|
||||
}
|
||||
}
|
||||
|
||||
return Json(statusCode, &resp)
|
||||
}
|
||||
|
||||
// GET /api/tsdb/testdata/scenarios
|
||||
@@ -114,3 +135,12 @@ func GenerateError(c *middleware.Context) Response {
|
||||
var array []string
|
||||
return Json(200, array[20])
|
||||
}
|
||||
|
||||
// GET /api/tsdb/testdata/gensql
|
||||
func GenerateSqlTestData(c *middleware.Context) Response {
|
||||
if err := bus.Dispatch(&models.InsertSqlTestDataCommand{}); err != nil {
|
||||
return ApiError(500, "Failed to insert test data", err)
|
||||
}
|
||||
|
||||
return Json(200, &util.DynMap{"message": "OK"})
|
||||
}
|
||||
|
||||
+2
-1
@@ -12,7 +12,8 @@ func SendResetPasswordEmail(c *middleware.Context, form dtos.SendResetPasswordEm
|
||||
userQuery := m.GetUserByLoginQuery{LoginOrEmail: form.UserOrEmail}
|
||||
|
||||
if err := bus.Dispatch(&userQuery); err != nil {
|
||||
return ApiError(404, "User does not exist", err)
|
||||
c.Logger.Info("Requested password reset for user that was not found", "user", userQuery.LoginOrEmail)
|
||||
return ApiError(200, "Email sent", err)
|
||||
}
|
||||
|
||||
emailCmd := m.SendResetPasswordEmailCommand{User: userQuery.Result}
|
||||
|
||||
@@ -23,9 +23,14 @@ func TestPluginProxy(t *testing.T) {
|
||||
setting.SecretKey = "password"
|
||||
|
||||
bus.AddHandler("test", func(query *m.GetPluginSettingByIdQuery) error {
|
||||
key, err := util.Encrypt([]byte("123"), "password")
|
||||
if err != nil {
|
||||
return err
|
||||
}
|
||||
|
||||
query.Result = &m.PluginSetting{
|
||||
SecureJsonData: map[string][]byte{
|
||||
"key": util.Encrypt([]byte("123"), "password"),
|
||||
"key": key,
|
||||
},
|
||||
}
|
||||
return nil
|
||||
|
||||
Some files were not shown because too many files have changed in this diff Show More
Reference in New Issue
Block a user